People hold up signs at a protest, including one reading Free Gaza Free Palestine with a drawing of the Palestinian flag, and others partially visible in the background.

American Muslim Poll 2025: Spotlight on Muslim Voters

BY SAHER SELOD, PHD, DALIA MOGAHED, ERUM IKRAMULLAH, AND SARAH BAKER
PUBLICATION DATE
Published October 21, 2025

Biography

Muslim Voters: Growing Civic Engagement

American Muslims are engaging more with the electoral process. Muslim voter registration has been steadily increasing. Efforts by Muslim civic organizations in the 2020 presidential election, like Emgage’s Million Muslim Votes campaign, reflect the efforts made over the last decade to improve voter turnout of American Muslims.

Growing Muslim Voter Registration Puts Them on Par with All Other Groups Except Jews

American Muslims are the least likely group to be legally eligible to vote (79%) compared to 90% of the general public and 95% of Jewish voters. They are, however, on par with almost all other groups, including the general public, in voter registration among legally eligible voters. Voter eligibility among Muslims in 2025 (79%) has dropped slightly since 2017, when it was at 86%. In 2025, Muslims ages 50+ (91%) are more likely than 18-to-29-year-old Muslims (75%) to be legally eligible to vote in the U.S. White (82%), Black (86%), and Arab Muslims (80%) are more likely to be legally eligible to vote than Asian Muslims (61%). Among the general public, Hispanics (82%) are less likely than white (95%) and Black Americans (96%) to be legally eligible to vote.

Overall, Muslim voter registration among legally eligible voters is equivalent to most other religious groups in the U.S., with 85% of Muslims who are legally eligible to vote being registered to vote, which is less than 92% of Jews and on par with all other groups (87% of Catholics, 83% of Protestants, 87% of white Evangelicals, and 84% of both the non-affiliated and the general public).


Bar chart comparing percentages of various religious groups registered to vote: Muslim (85%), Jewish (92%), Catholic (87%), Protestant (83%), White Evangelical (87%), Non-Affiliated (84%), General Public (84%).

Among Muslims Who Are Legally Eligible to Vote, Women and Non-White Muslims Are Least Likely to Be Registered

Among Muslims who are legally eligible to vote, 92% of men are registered to vote, which is more likely than 76% of Muslim women. We previously identified Muslim women as a population of interest for GOTV efforts. Similarly, Catholic men (93%) and men in the general public (87%) are more likely than Catholic women (81%) and women in the general public (81%) to be registered to vote.

When it comes to race and ethnicity, among Muslims who are legally eligible to vote, white Muslims (96%) are more likely than Asian Muslims (82%) to be registered to vote. White voters (86%) in the general population are more likely to be registered to vote compared to Latino voters (75%) but are on par with other racial and ethnic groups.

Muslim Voter Registration on Steady Rise since 2016

Among Muslims who are legally eligible to vote, 92% of men are registered to vote, which is more likely than 76% of Muslim women. We previously identified Muslim women as a population of interest for GOTV efforts. Similarly, Catholic men (93%) and men in the general public (87%) are more likely than Catholic women (81%) and women in the general public (81%) to be registered to vote.

When it comes to race and ethnicity, among Muslims who are legally eligible to vote, white Muslims (96%) are more likely than Asian Muslims (82%) to be registered to vote. White voters (86%) in the general population are more likely to be registered to vote compared to Latino voters (75%) but are on par with other racial and ethnic groups.

A line graph showing the percentage of Muslims registered to vote, rising from 60% in 2016 to 85% in 2025. Percentage markers are shown for each year. Source: Institute for Social Policy & Understanding.

Age, Income, and Mosque Attendance Are Predictors of Voter Participation More Broadly

We used multivariate logistic regression to examine predictors of voting in the 2024 presidential election among Muslims and the general public (controlling for age, income, gender, education, and other covariates). Among Muslims, political party affiliation, political ideology, and contacting elected officials did not affect one’s likelihood to vote. Instead, demographic and religious variables were the strongest predictors of voter turnout. Specifically among Muslims, those ages 60 and older (compared to 18-to-29-year-olds), those earning $75,000 or more (compared to those earning less than $30,000), those who are white (vs. non-white Muslims), those who are American born (compared to those born outside the U.S.), those who attend the mosque weekly (vs. those who attend less frequently), and those who expressed any Islamophobia (compared to those who expressed none) were significantly more likely to have voted in 2024.

Among the general public, those earning $30,000 or more (compared to those earning less than $30,000), those ages 45 and older (compared to 18-to-29-yearolds), and those who contacted a local elected official (compared to those who did not) were significantly more likely to have voted in 2024. Any expressed Islamophobia, political party affiliation, political ideology, and religiosity were not significant predictors of voter turnout for the general public.

Infographic showing factors predicting 2024 presidential voting among Muslims: age 60+, high income, White race, American-born, frequent religious attendance, and experience of Islamophobia. Illustration of voting ballot.

How Muslims Voted in 2024

Among Registered Voters, Muslims and the Non-Affiliated Were Least Likely to Cast a Ballot in the November 2024 Election

Of those registered to vote, 80% of Muslims voted in the 2024 election. This is significantly less than 91% of registered voters who voted among the general public, 94% among Jews, 92% among Catholics, and 95% among Protestants and white Evangelicals.

Half of Muslim Voters Selected Kamala Harris for President in 2024

Muslim voters were in the spotlight during the 2024 election. Even though they are a small percentage of the total U.S. population, there are enough Muslims to determine presidential elections in key swing states (for example, in 2020 when the presidential election came down a few thousand votes). Exit polling by some organizations showed a large percentage of Muslims voted for Jill Stein in 2024, and media articles highlighted that many Muslim voters who had previously voted Democrat did not continue this course in the 2024 election.

Our survey shows that 50% of Muslims (similar to the general public) voted for Kamala Harris, more than Protestants (39%) and white Evangelicals (14%) but less than Jews (70%) and those who are religiously unaffiliated (74%).

Thirty-one percent of Muslims in the survey voted for Trump, less than Catholics (50%), Protestants (57%), white Evangelicals (82%), and the general public (45%) but on par with Jews and the religiously non-affiliated.

Jill Stein’s highest support was by far among Muslims (12%) compared to 1% or less of other groups in 2024 and compared to 2020 when Stein received less than 1% of the Muslim vote. Only 3% of Muslims who were registered to vote cast a ballot in 2024 but did not vote for a presidential candidate.

Bar graph showing 50% of Muslims and 50% of the general public voted for Kamala Harris, 31% of Muslims and 45% of the general public for Trump, 12% of Muslims for Jill Stein, and 7% for other/write-in.

Unlike Women in Other Religious Groups, Muslim Women Stand Apart from Their Male Counterparts on Trump

Muslim men were far more likely than Muslim women to vote for Donald Trump (42% vs. 17%), but both were equally likely to have voted for the other candidates. Among the other groups, there were no gender differences when it came to presidential candidate selection.

Bar chart showing 42% of Muslim men and 17% of Muslim women plan to vote for Trump in 2024. The chart is titled, “Muslim Women Less Likely than Muslim Men to Vote for Trump in 2024.”.

Broken down by race and ethnicity, the majority of Black Muslims (76%) voted for Harris and the plurality of white Muslims (49%) voted for Trump. Asian Muslims (22%) were the highest represented group who voted for Jill Stein, although 50% voted for Harris. Only white voters from the general public had a majority of Trump voters (53%), while the majority of Black Americans (90%) and plurality of Latinos (49%) voted for Harris. Arab Muslim voters were too small a sample to report.

Bar chart showing 2024 U.S. presidential vote among White, Black, and Asian Muslims, and the general public, by candidate. Nearly half of White Muslims voted for Trump; most Black Muslims supported Harris.

Predictors of Trump Supporters

We used a regression analysis to identify the factors that influenced supporting Trump in the 2024 election. We conducted this analysis separately for Muslims, Jews, and the general public. Being or leaning Republican (vs. all other political affiliations) is a significant predictor of voting for Trump among Muslims, Jews, and the general population. Holding somewhat or very conservative political views (vs. moderate or liberal views) predicts a vote for Trump among the general population. A high household income ($75,000 or more vs. $30,000 or less) predicts a vote for Trump for Muslims and Jews. For Muslims, being born in the U.S. (vs. being foreign born) is associated with a greater likelihood of voting for Trump. Older age for the general public and Jews (ages 45 and older for the general public and ages 30 and older for Jews vs. 18-to-29-year-olds for both groups) predicts voting for Trump but not for Muslims. Race, specifically being white, for the general public and Muslims, is associated with greater likelihood of voting for Trump. Among Jews, weekly religious attendance is a predictor for voting for Trump, but not for the general public or Muslims. For the general public, being a college graduate (compared to lower levels of education) is associated with a lower likelihood of voting for Trump.

Any expressed Islamophobia based on ISPU’s Islamophobia Index (discussed in more detail later in this report) predicts voting for Trump for Muslims and the general public but not for Jews. This means that, for Muslims and the general public, agreeing with any of the false Islamophobic tropes we ask about makes one more likely to vote for Trump.

Obstacles to Voting

Muslims Remain the Most Likely Religious/Non-Religious Group to Report Facing Obstacles to Voting

The 2022 American Muslim Poll identified that even though voter turnout for American Muslims is increasing, Muslims still encounter obstacles to voting. In 2024, this trend continued. At 37%, Muslims are the most likely faith/non-faith group to experience obstacles to voting, compared to 4%–16% of other groups. Long wait times to cast a ballot was the most often cited obstacle faced by Muslims (16%), followed by intimidation by private citizens (14%), two experiences that were reported less often by the general public (6% and 2% respectively). White Muslims (54%) reported they were the most likely to experience obstacles to voting followed by Black Muslims (36%) and Asian Muslims (29%). White Muslims were more likely to say they experienced intimidation by private citizens (21%) compared to the general public (2%), followed by Black Muslims and Asian Muslims (both at 9%). Among the general public, it was Hispanic voters who were the most likely racial/ethnic group to experience voting obstacles.

Bar graph showing percentages of groups reporting obstacles to voting in 2024: Muslim 37%, Jewish 12%, Catholic 16%, Protestant 8%, White Evangelical 4%, Non-Affiliated 13%, General Public 11%.

Muslim Votes Shift

Comparing the 2024 Vote Choice vs. 2020 Vote Choice

Muslims have shifted over the last few decades in terms of party affiliation. Prior to 9/11 in the 2000 presidential election, the majority of South Asian and Arab Muslims voted Republican while African American Muslims voted Democrat; however, due to American foreign policy in Iraq and Afghanistan and increased levels of discrimination initially institutionalized against Muslims under Republican administrations via counterterrorism policies, Muslims began to flock to Democratic candidates (Jalalzai, 2009). And while the majority of Muslims voted Democrat in 2020, the genocide in Gaza and increased scrutiny of Muslims in schools and workplaces has interrupted this trend.

Among the general public, 79% of those who voted for Joe Biden in 2020 reported voting for Kamala Harris in 2024. Similarly, 81% of those among the general public who voted for Trump in 2020 reported voting for him in 2024. For the general public, just 2% of those who voted for Biden in 2020 voted for someone else besides Harris or Trump in 2024, while 1% of those who voted Trump in 2020 reported voting for someone else besides Harris or Trump in the 2024 presidential election. Among Muslims, however, only 55% of those who voted for Biden in 2020 reported voting for Harris in 2024, while 82% of Muslims who voted for Trump in 2020 reported voting for him in 2024. This shows a drop in Muslim votes for the Democratic candidate between the 2020 and 2024 presidential elections.

Further analysis reveals how these 2020 Democratic voters shifted in 2024. A small percentage of Muslim voters appear to have shifted between the Democratic and Republican presidential candidates over the last few elections. Ten percent of Muslims who voted for Biden in 2020 reported voting for Trump in 2024. Sixteen percent of Muslims who voted for Biden in 2020 reported voting for a third-party candidate or some other candidate besides Harris or Trump in 2024, and 19% did not vote for president in 2024. On the other hand, just 1% of Muslims who voted for Trump in 2020 reported voting for someone else besides Harris or Trump in 2024.

Influences on 2024 Presidential Candidate Choice

In the 2025 American Muslim Poll, ISPU surveyed voters on what factors influenced their presidential candidate preference. With the rise of newer social media platforms, such as TikTok since 2021, it is important to reassess what influences American Muslim voters and their choices.

Family/Friends and Political Party Affiliation Were the Most Salient Factors Influencing Muslims’ Presidential Candidate Choices in 2024

The most important factors that influenced American Muslims’ vote choices were family and friends (53%), political party affiliation (49%), and social media influencers (40%). The top influences for Jewish voters and the general public were political party affiliation (36% and 33%, respectively), family and friends (23% for both), and mainstream media (16% and 17%, respectively). Muslim voters were more likely to have their presidential candidate vote influenced by local religious congregations and national religious leaders (35% for both) as well as national civic organizations associated with their religious group (36%) compared to all other groups and the general public (ranging from 6% to 19% on all three items).

Muslims Report Economy/Job Creation and the War in Gaza as the Most Important Policy Priorities That Influenced Presidential Candidate Choice

The 2024 presidential election was a unique year for Muslim voters. Muslim voters organized around the war in Gaza, from state and national campaigns such the Listen to Michigan campaign,uncommitted movement, and Never Biden campaign to local phonebanking efforts aimed at state and federal representatives. These efforts reflected how a significant share of Muslims coalesced around a single issue, the war in Gaza, unifying many of them in ways that had not been seen previously among American Muslim voters. In 2024, the economy and jobs (41%) and the war in Gaza (35%) were the most salient issues in terms of presidential candidate choice for American Muslims. While these were the top two issues, Muslim policy priorities overall still do not match a clean partisan profile. Muslims care about Democrat-aligned issues, like climate change and healthcare, as much as Jews and those who are not religiously affiliated but are less likely to name preserving democracy (12%) as a top priority compared to Jews (37%), Catholics (25%), and those who are non-affiliated (39%).

Muslims (41%) are less likely than the general public (50%), Protestants (52%), and white Evangelicals (56%) to name the economy/job creation as a policy priority. They were more likely to name the war in Gaza as a priority (35%), compared to 10% of Jews and all other groups including the general public (3%–4%). Just 3% of Muslims identified preserving traditional values concerning gender and marriage as a top policy priority, on par with 1%–5% of most other groups but less than white Evangelicals (20%) and Protestants (10%).

Among Muslims, Women, Asians, and Young People More Likely to Name Gaza as a Top Policy Priority in the 2024 Election

Muslim women (41%) were more likely than Muslim men (30%) to list the war in Gaza as their top issue. For Muslims ages 18–29 (47%) and 30–49 (37%), the war in Gaza was the most important policy issue by which to judge their presidential candidate, while 55% of Muslims ages 50+ rated the economy and job creation as the most important policy. This reflects a difference in policy priorities based on age for Muslim voters. When it comes to race and ethnicity, Asian Muslims (59%) ranked the war in Gaza as their top policy issue, while white (37%) and Black Muslims (53%) ranked the economy and job creation as their top issue. For white Muslim voters, the war in Gaza (32%) was their second most important issue, and for Black Muslim voters, healthcare (33%) was the second most important policy issue. Twelve percent of Black Muslim voters cited the war in Gaza as a policy priority in the 2024 presidential election. Arab Muslims were too small a sample to report.

Policy Priorities Based on 2024 Candidate Preference

Among those in the general public who voted for Trump in the 2024 election, the top three policy priorities were securing the border (63%), the economy (59%), and immigration reform (21%). For Harris supporters in the general public, the top policy priorities were preserving democracy (43%), the economy (43%), and healthcare (28%). The economy was the only shared top policy priority for Harris and Trump voters.

On the other hand, for Muslim Trump supporters, the top three policy priorities were the economy (32%), the war in Gaza (30%), and taxes (27%). For Muslim Harris supporters, the top three policy priorities were the economy (49%), healthcare (29%), and the war in Gaza (22%). For Muslims who voted third party or for another candidate, the top policy priorities were the war in Gaza (78%), the economy (34%), and keeping the U.S. out of foreign wars (20%). Thus, the war in Gaza is a shared top policy priority across Harris, Trump, and third-party Muslim voters. At the same time, Muslims who voted for a third-party candidate were far more likely to have named Gaza as a policy priority driving their vote, helping to explain why 16% of the Muslims who voted for Biden in 2020 shifted to a third-party candidate in 2024.

Impact of 2024 Presidential Election

Fear of Economic Insecurity Tops Post-Trump Election Impact among All Groups

Among all groups, the most frequently cited impact of the 2024 presidential election is fear of economic insecurity for oneself or a member of their household. For Muslims, 44% report a fear of economic insecurity for themselves or a member of their household as a result of the outcome of the 2024 presidential election, on par with 45% of Jews, 40% of Catholics, and 51% of the non-affiliated but more likely than 27% of Protestants and 14% of white Evangelicals.

A table shows percentages of different religious groups and the general public reporting various concerns after the 2024 election, such as fear of economic insecurity, job loss, and emotional distress.

Muslims Most Likely Group to Fear for Their Personal Safety as a Result of the Outcome of the 2024 Presidential Election

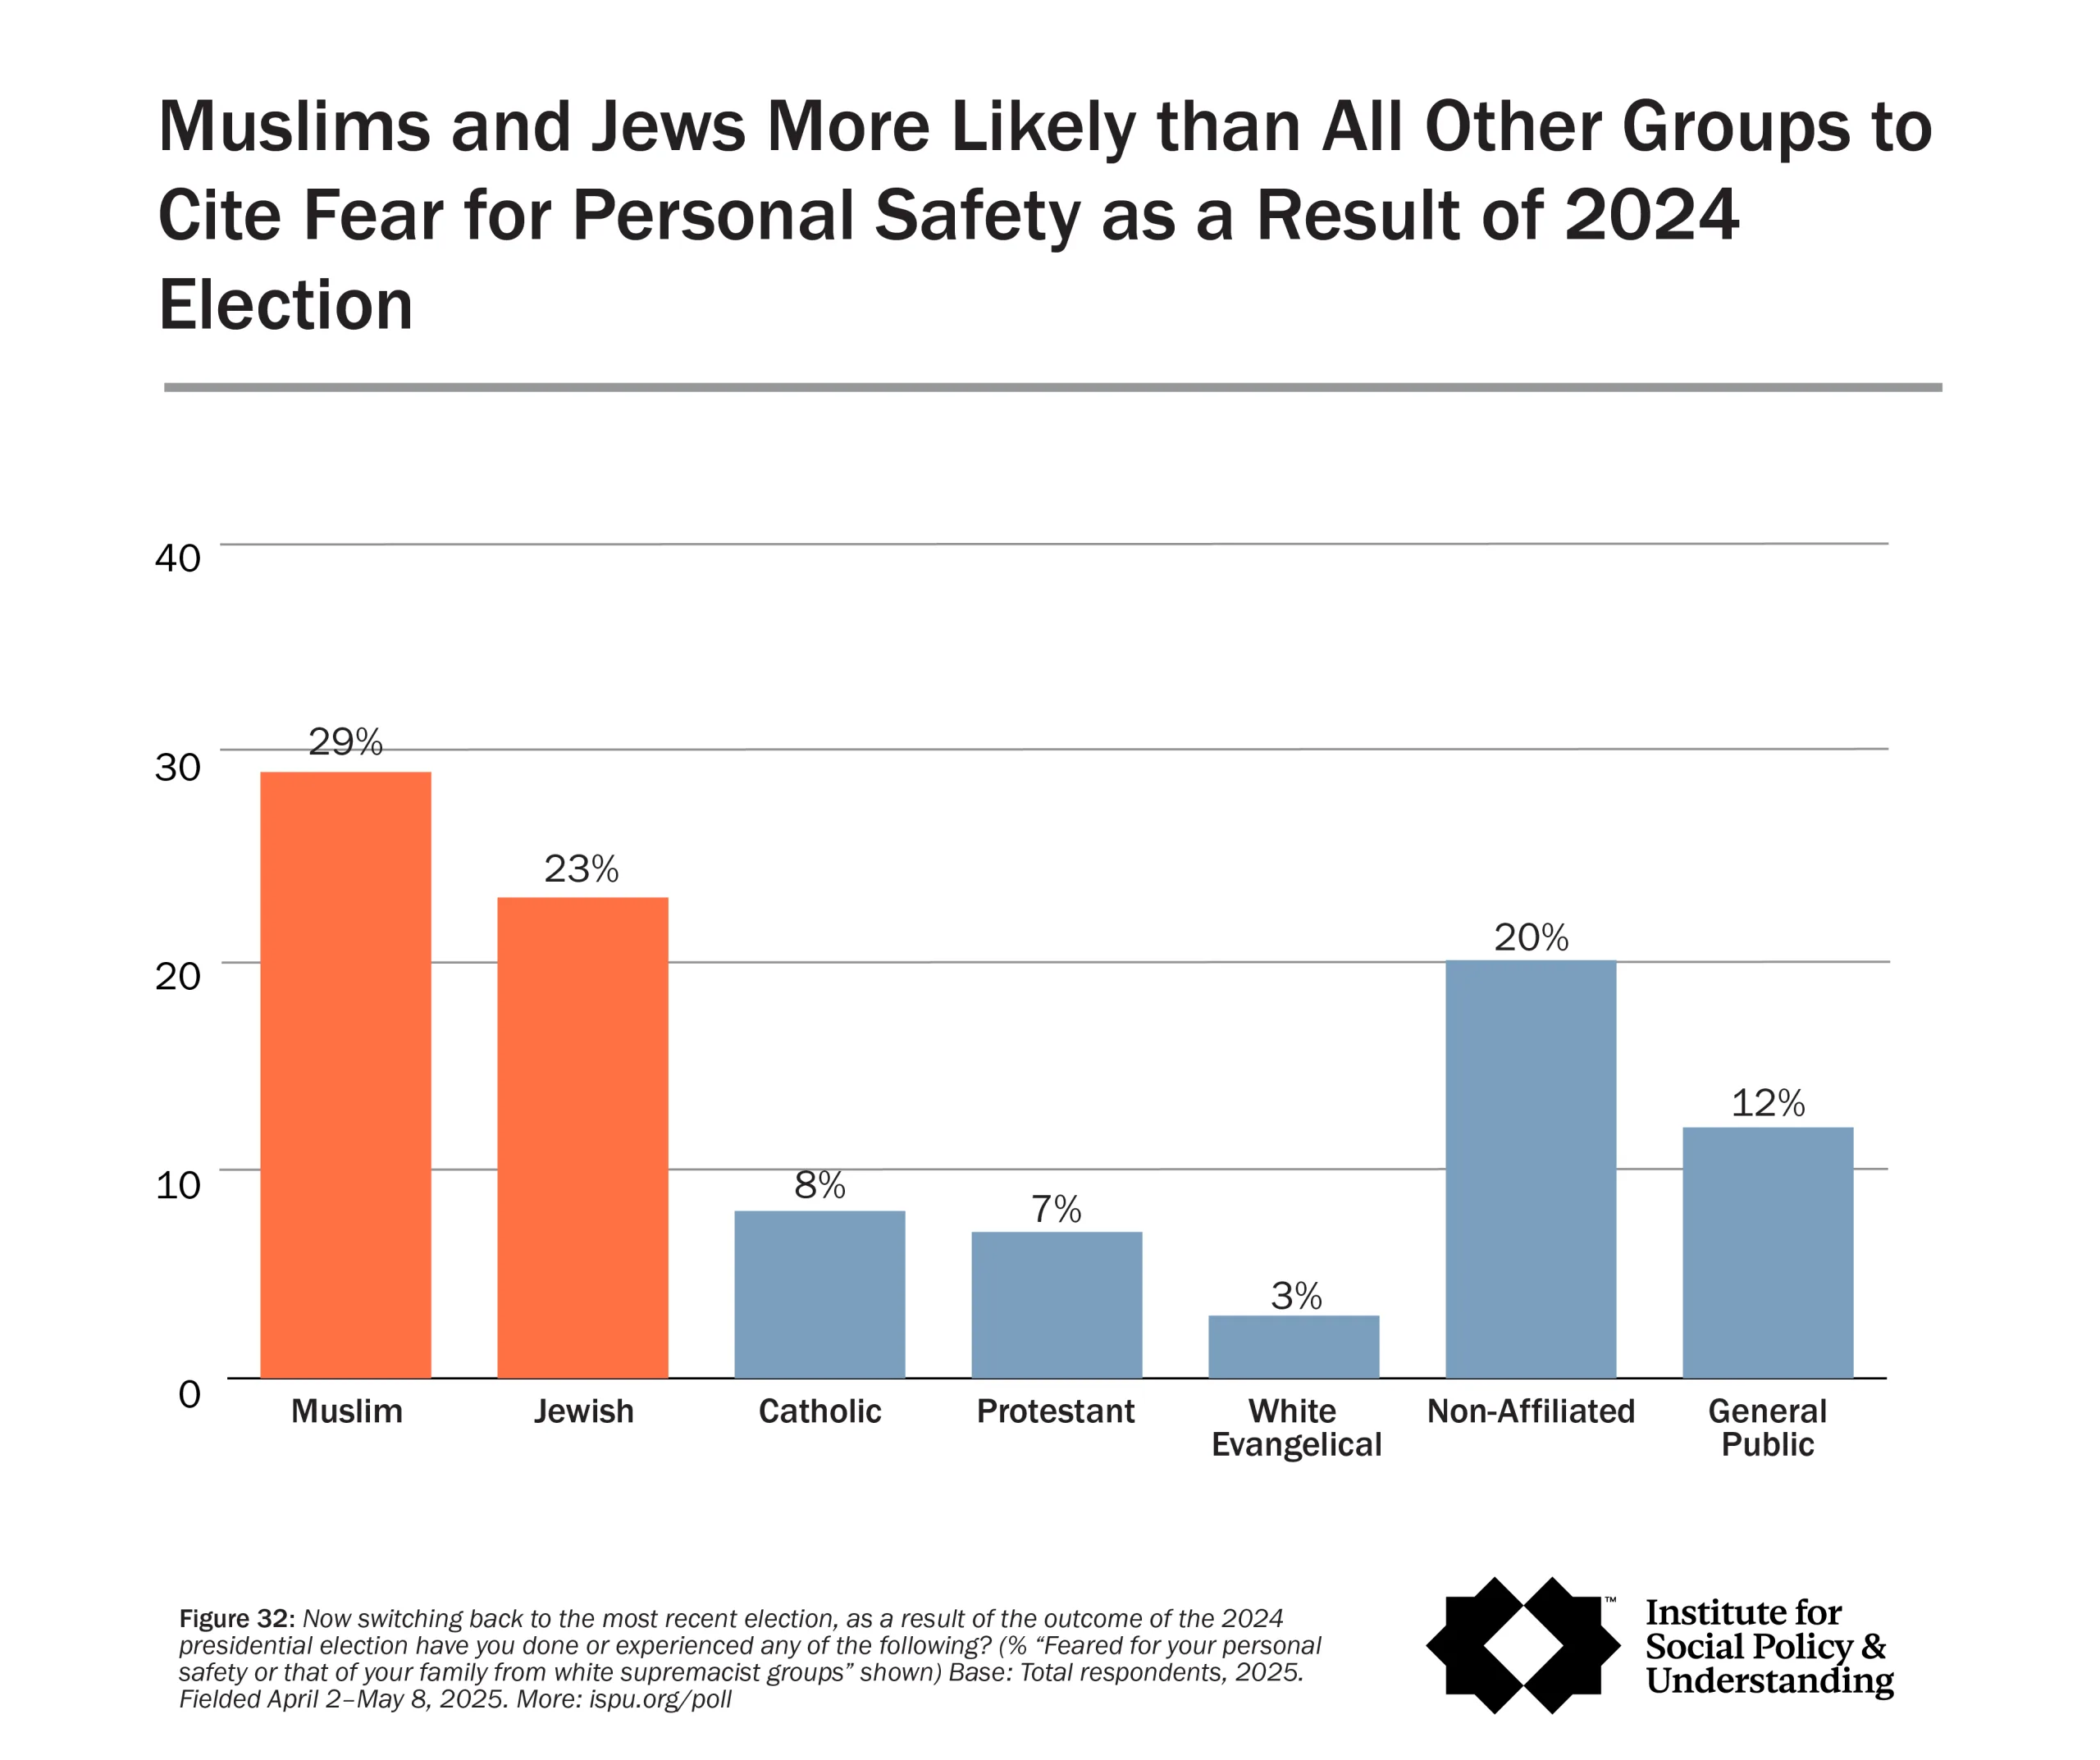
Muslims (29%) are more likely than Catholics (8%), Protestants (7%), white Evangelicals (3%), the non-affiliated (20%), and the general public (12%) to fear for their personal safety. Nearly a quarter of Jews (23%) reported fearing for their personal safety, on par with Muslims. ​Muslim women (36%) are more likely to fear for their personal safety than Muslim men (24%). Muslims ages 18–29 rated fear for their family members’ personal safety from white supremacists (39% and fear related to their immigration status (31%) more highly than Muslims ages 30–49 (25% and 18%, respectively) and 50+ (21% and 11%, respectively).

Bar graph showing percentages of religious groups who fear for personal safety due to the 2024 election: Muslim (29%), Jewish (23%), Catholic (8%), Protestant (7%), White Evangelical (3%), Non-affiliated (20%), General public (12%).

Fourteen percent of Muslims modified their appearance to be less visible as Muslims, Muslim men and women equally likely to do so (17% and 11%, respectively). Muslims are also the group most likely to fear due to their immigration status (22%) compared to other groups (1%–6%). Asian Muslims (43%) were the most likely to fear for their immigration status compared to white Muslims (14%), Black Muslims (18%), and Arab Muslims (18%). For the general public, Hispanics (13%) were more likely to fear for their immigration status compared to white (2%) and Black Americans (3%).

Compared to 2016 Election, Muslims More Stressed after 2024

Between 2017 and 2025, the proportion of Muslims who suffered emotionally with stress and anxiety enough to believe they needed services from a mental health professional almost doubled, rising from 13% in 2017 to 22% in 2025.

Though Muslims and Jews are more likely to report fear for their personal safety from white supremacists than all other faith or non-faith groups, for Muslims the 2025 result (29%) is actually a drop from 2017 (38%). There was also a significant drop in the percentage of Muslims who engaged with civic organizations for the first time as a result of the presidential election (from 18% in 2017 to 9% in 2025).

The proportion of Muslims who experienced the following as a result of the prior year’s presidential election did not differ between 2017 and 2025: made plans to leave the country if necessary (18% in 2017 and 20% in 2025), modified their appearance to be less identifiable as a member of their religious community (15% in 2017 and 14% in 2025), decreased donations to organizations associated with their faith community (8% in 2017 and 9% in 2025), and removed their children from public school (5% in 2017 and 4% in 2025).

A bar chart comparing Muslims and the general public’s emotional distress and related actions after U.S. elections in 2017 and 2025, showing higher distress and impacts for Muslims across several categories.

Muslim Satisfaction and Presidential Approval Drop

Muslim Satisfaction with the Direction of the Country Has Dropped since 2022

For the first time since 2018, satisfaction with the country’s direction among American Muslims has declined, falling from 48% in 2022 to 23% in 2025. This satisfaction is also significantly lower than in 2017 (41%) when Trump was also in office and campaigned on overtly anti-Muslim rhetoric.

Despite the decline, American Muslims remain more satisfied with the country’s direction than the religiously unaffiliated (12%) but less than white Evangelicals (38%). The portion of Muslims who are satisfied with the direction of the country is on par with the general public (24%), Jews (17%), Catholics (28%), and Protestants (30%) at a 95% confidence interval used throughout the report.

Satisfaction with the Direction of the Country Varies by Gender, Age, and Race

In 2025, notable gender differences emerged in satisfaction with the country’s direction. Among Muslims, men were significantly more likely than women to express satisfaction (30% vs. 14%). This pattern held across other groups as well, including Protestants (36% of men vs. 24% of women), white Evangelicals (51% of men vs. 27% of women), and the general public (28% of men vs. 20% of women).

Consistent with previous years, Muslims ages 30–49 were most likely to be satisfied with the country’s direction in 2025. Thirty-six percent of 30-to-49-year-old Muslims expressed satisfaction, compared to 14% of 18-to-29-year-olds and 15% of Muslims ages 50 and older. In contrast, among the general public, those ages 50 and older were more likely to express satisfaction with the country’s direction in 2025 than those ages 30–49 (27% vs. 18%).

In 2025, white Muslims were most likely to express satisfaction with the country’s direction at 44%, scoring higher than all other Muslim ethnic groups: Black Muslims at 18%, Arab Muslims at 22%, and Asian Muslims at 11%.

American Muslims Are Less Likely than the General Public and Other Groups to Approve of Donald Trump’s Job Performance

In 2025, about one fifth (21%) of American Muslims approved of the way Donald Trump handled his job as president. This was on par with Jews (17%) and the non-affiliated (20%) but lower than Protestants (41%), Catholics (34%), white Evangelicals (63%), and the general public (32%).

Bar graph showing approval of Donald Trump by group: Muslim 21%, Jewish 17%, Catholic 34%, Protestant 41%, White Evangelical 63%, Non-Affiliated 20%, General Public 32%. Title notes Muslims less likely to approve.

Among Muslims, Men, 30-to-49-Year-Olds, and Those Who Identify as White Are More Likely to Approve of President Trump

Among Muslims, men were significantly more likely (27%) than women (14%) to approve of President Trump. Age also played a factor in approval of President Trump. Among Muslims, those ages 30–49 were most likely to approve (33%), compared to younger Muslims ages 18–29 (15%) and older Muslims ages 50 and older (9%).

White Muslims expressed the highest approval rating for President Trump among all racial groups, with 41% expressing approval. This was significantly higher than Black Muslims (20%), Arab Muslims (16%), and Asian Muslims (8%). In the general public, 41% of white Americans expressed approval, compared to 25% of Hispanic Americans and 7% of Black Americans.

American Muslim Presidential Approval Drops since 2022

Following the same trend seen in the satisfaction with the direction of the country, Muslim presidential approval dropped sharply in 2025 compared to 2022 (21% for Trump in 2025 vs. 60% for Biden in 2022). This pattern was consistent among Jews, with approval falling from 58% in 2022 to 17% in 2025, and among the general public, from 42% in 2022 to 32% in 2025.

A line graph showing Muslim approval of the president’s job from 2016 to 2025, dropping from 80% in 2016 to 21% in 2025, with fluctuations in between.

Civic Engagement beyond Voting

Civic engagement beyond voting is assessed by the American Muslim Poll through town hall attendance, volunteering for a political campaign, contributing money to a political campaign, and contacting federal and local officials.

Muslim Engagement with Elected Officials Grows

Muslim were more civically engaged than most other groups in 2025. Muslims (22%) were less likely than Jews (31%) but more likely than the general public (17%) to contact their federal elected representative. Muslims who voted for Trump (51%) were more likely to contact a federal official than those who voted for Harris (26%) or some other candidate (27%), which was the opposite for the general public, with those who voted for Harris (26%) being more likely to contact a federal official compared to those who voted for Trump (18%).

Muslims (19%) were less likely than Jews (30%) to contact a local official but on par with Catholics (14%), Protestants (22%), white Evangelicals (19%), the non-affiliated (15%), and the general public (18%). White Muslims were more likely to contact their local elected officials compared to Black Muslims (28% vs. 13%, respectively). Muslims who voted for Trump (46%) were more likely to contact a local official than those who voted for Harris (23%). Among the general public, Trump and Harris voters were equally likely to have contacted their local elected officials (21% and 25%, respectively).

Muslims and Jews among the Most Civically Engaged

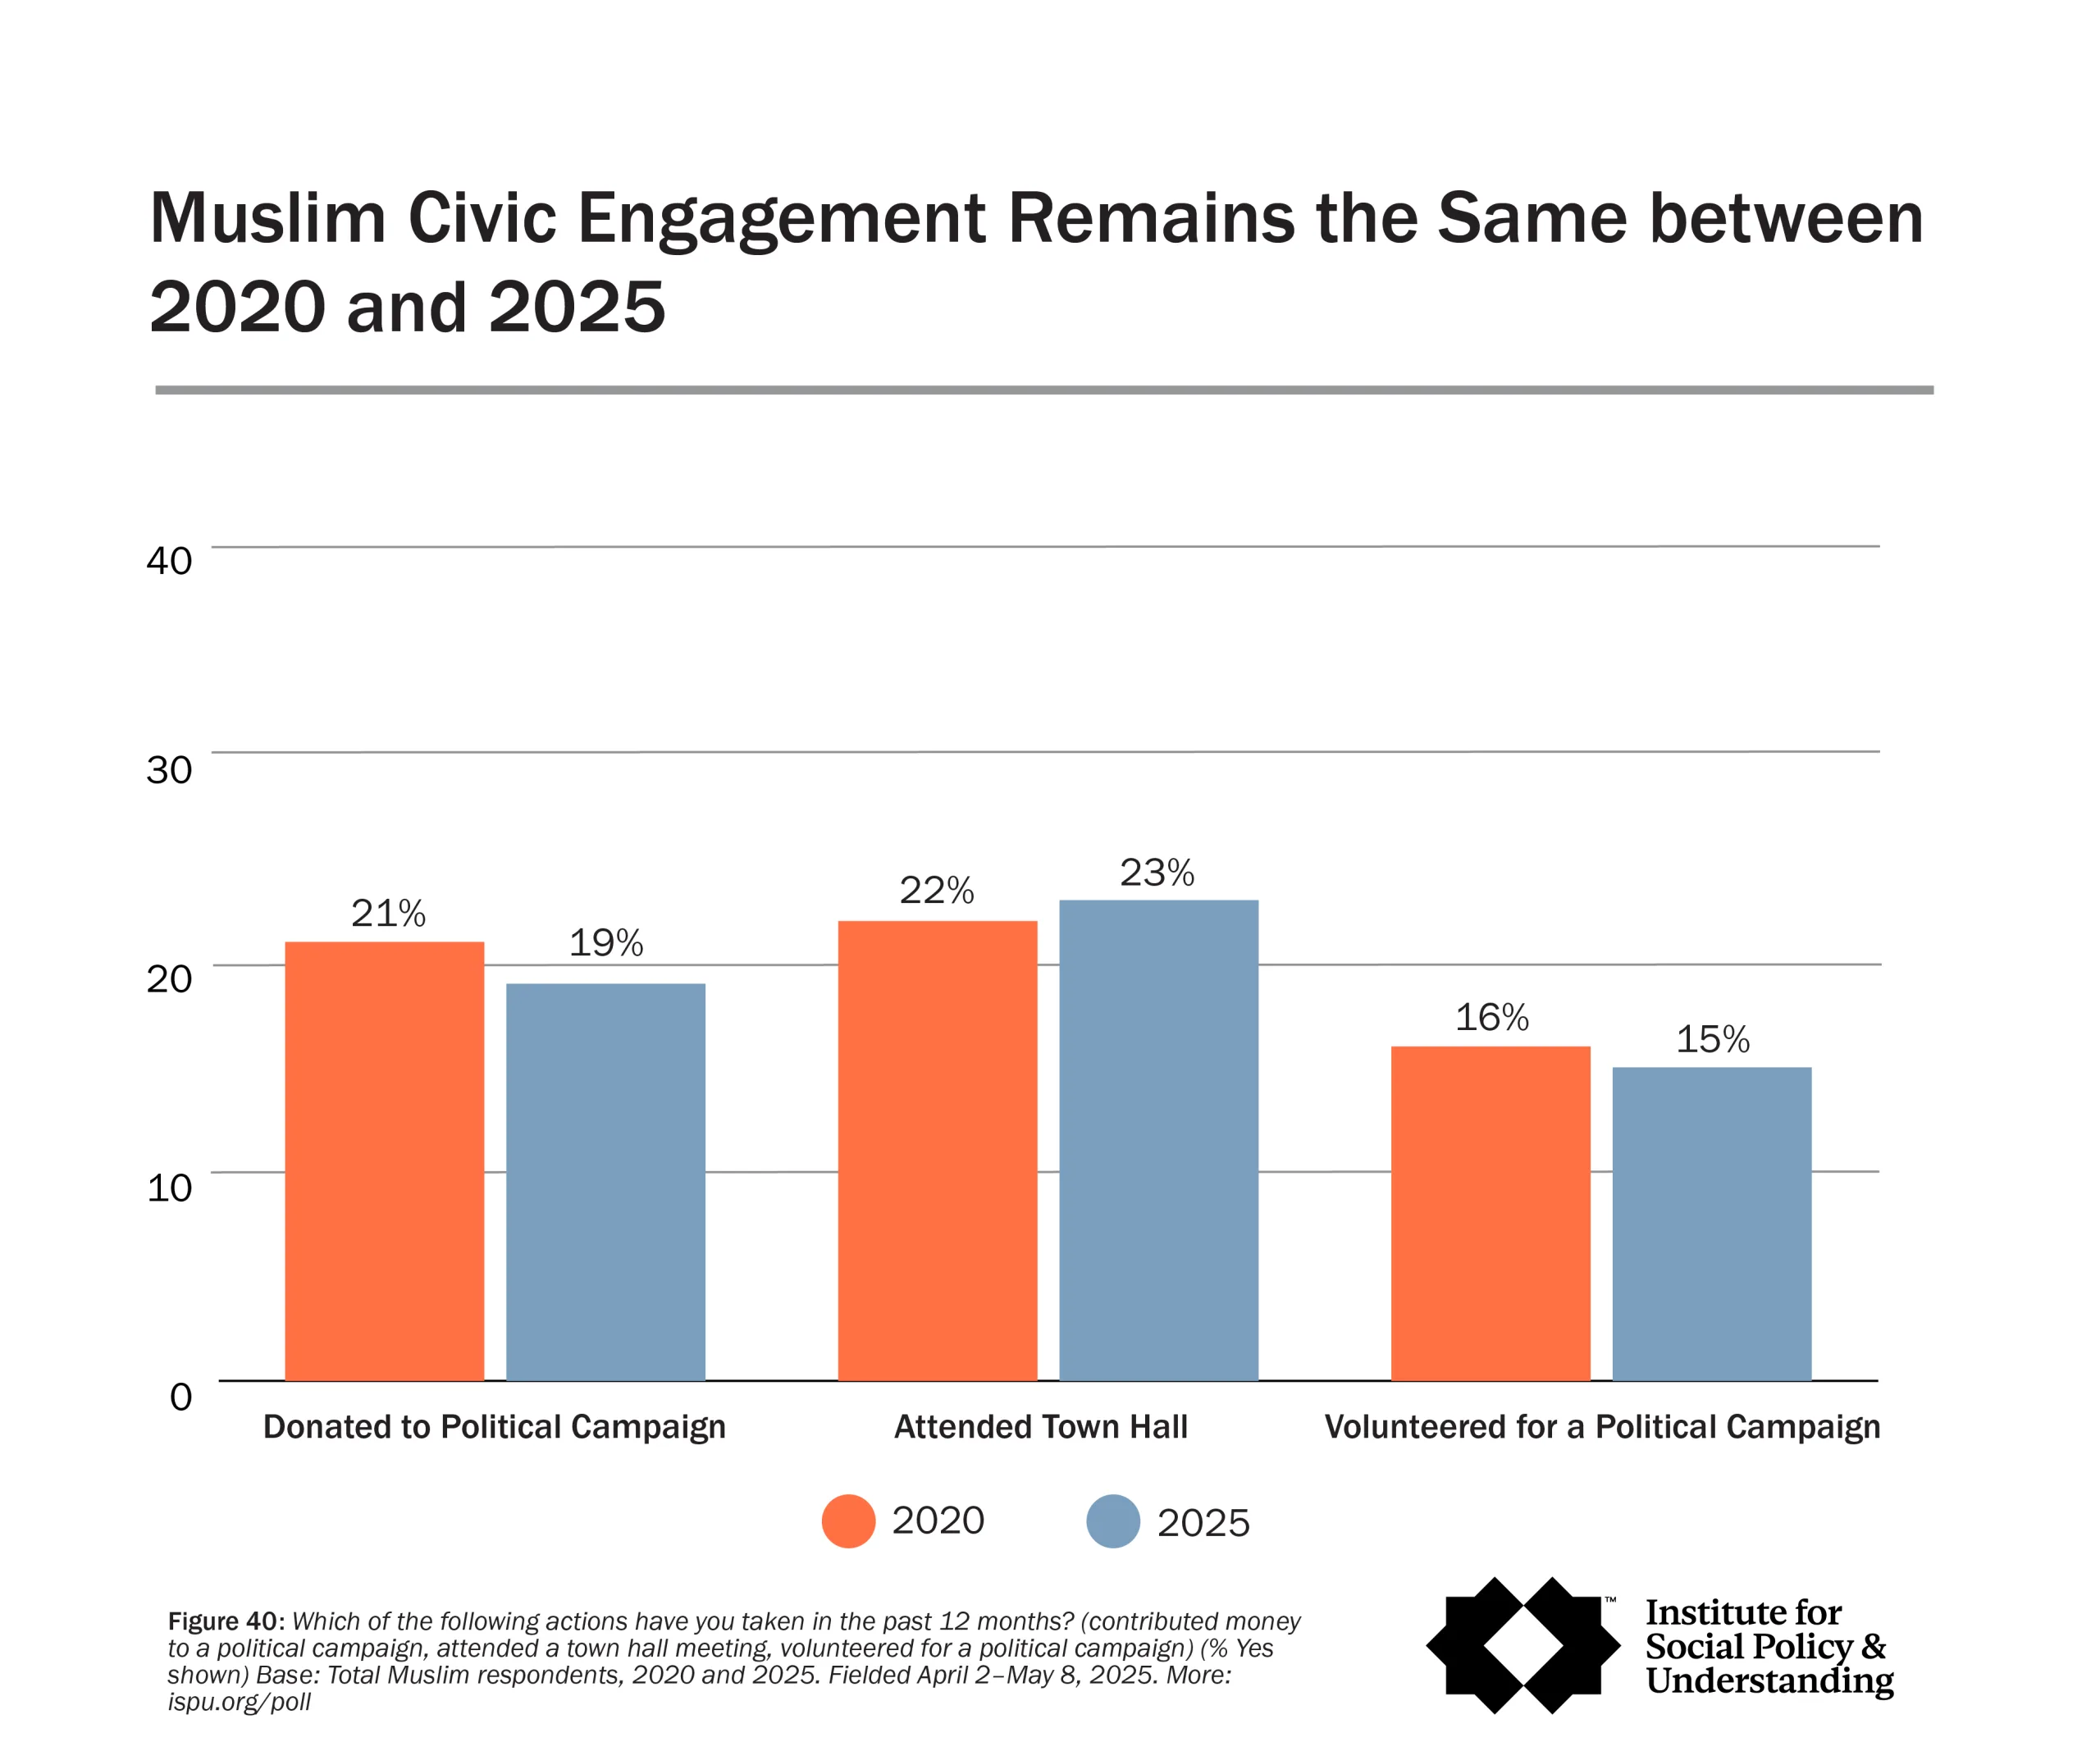
Muslims were the most likely to attend a town hall (23%) compared to Catholics (10%), Protestants (7%), white Evangelicals (4%), the non-affiliated (7%), and the general public (8%) but on par with Jews (18%).

Fifteen percent of Muslims reported volunteering for a political campaign in the year prior to the survey, more likely than 8% of Catholics, 6% of Protestants, 3% of white Evangelicals, 6% of the non-affiliated, and 7% of the general public but on par with Jews (12%).

Muslims (19%) were less likely to contribute to a political campaign compared to Jews (30%), who are the most likely of all groups, including the general public (15%), to have contributed to a political campaign in the last year. Muslim men were more likely to contribute than Muslim women (24% of Muslim men vs. 11% of Muslim women). White and Black Muslims were generally more likely to attend a town hall, volunteer, and contribute to a political campaign compared to Asian and Arab Muslims. Thirty-nine percent of white Muslims and 29% of Black Muslims attended a town hall, compared to 12% of Asian Muslims and 7% of Arab Muslims. Roughly one quarter of white Muslims (27%) volunteered for a political campaign, more likely than 5% of Asian and 12% of Arab Muslims. Sixteen percent of Black Muslims volunteered for a political campaign, which is more likely than Asian Muslims. Nearly one third of white Muslims (32%) and one quarter of Black Muslims (25%) contributed money to a political campaign, more likely than 9% of Asian and 8% of Arab Muslims.

A bar chart titled Muslim Civic Engagement Remains the Same between 2020 and 2025 compares three activities in 2020 and 2025: donating to campaigns, attending town halls, and volunteering for campaigns.

Muslim Trump Voters Participated in Greater Number of Civic Engagement Activities

Among Muslims, Trump voters have a higher average number of the five civic engagement activities surveyed compared to Harris voters and those who voted for someone else (2.39 vs. 1.25 vs. 0.75), while among the general public, Harris voters have a higher average number of civic engagement activities than Trump voters (0.98 vs. 0.67).

Support for Trump Policies

Our survey was fielded April 2–May 8, 2025, three months into President Trump’s second term in office and amid a flurry of proposed and implemented executive orders. We asked the following question to assess the public’s views on several Trump polices:

Rate your level of support for the following policies of the Trump administration:

  • To recognize two sexes, male and female
  • Termination of federal “diversity, equity, inclusion, and accessibility” (DEI) mandates, policies, programs, and activities in the federal government
  • The proposed forced displacement of Palestinians from Gaza
  • Expansion of immigration enforcement, detention, and deportations by the Department of Homeland Security (DHS) and Immigration and Customs Enforcement (ICE)
  • The deportation of students who participated in protests against the war in Gaza
  • Tariffs on imports from Canada, Mexico, and China
  • The proposed cutting of Medicare and Medicaid
  • The creation of the Department of Government Efficiency (DOGE)
  • Reducing the federal workforce by eliminating jobs

Only a Minority of Muslims Support Trump Policies, with the Exception of Gender Definition

The majority of Muslims oppose all the Trump policies we asked about with the exception of defining gender as male and female, where more than half (52%) support it, as do the majority of Catholics (53%), Protestants (65%), and white Evangelicals (84%). In fact, the recognition of two sexes was the most supported Trump policy among the general public, with half (50%) expressing support. On the other hand, one third of Jews (33%) and 28% of the non-affiliated expressed support for this policy. A plurality of Muslims (48%) oppose the creation of DOGE, while only 23% support it.

Looking now at the wider public, when it comes to other policies of the Trump administration, only a minority of the American general population supports his most high-profile policies. This includes the expansion of ICE (42%); the termination of DEI in the federal government (34%); the creation of DOGE (30%); tariffs on imports from Canada, Mexico, and China (29%); and reducing the federal workforce by eliminating jobs (28%). The three policies we asked about that garnered the least support among the general public were the deportation of students for protesting against the war in Gaza (24%), the displacement of Palestinians from Gaza (17%), and proposed cuts to Medicare and Medicaid (10%).

Overall, white Evangelicals are the most likely group to support President Trump’s policies. The majority of white Evangelicals supported all of the policies except for two notable exceptions: the proposed forced displacement of Palestinians from Gaza (31%) and proposed cuts to Medicare and Medicaid (19%). On the other side of the spectrum, Jews are the least likely to support any of the Trump policies we asked about, with no policy garnering more than a minority of Jewish support.

A chart titled “Most Trump Policies Supported by Less than Half of Americans” showing percentages of support for various policies among different religious groups and the general public. Data is from the Institute for Social Policy and Understanding.

Jewish and General Public Support for Muslim Ban Falls since 2018, Holds Steady among Muslims

In 2018, during President Trump’s first term in office, we asked about the level of support for the so-called “Muslim ban.” We asked the same question in the 2025 American Muslim Poll. Support for the “Muslim ban” declined between 2018 and 2025 among Jewish communities, from 24% of Jews expressing support in 2018 to 15% in 2025. Similarly, there was a decline in support for the “Muslim ban” among the general public, with 28% expressing support in 2018 and 20% expressing support in 2025.

In 2025, the majority of Muslims and Jews oppose a “Muslim ban” (71% and 61%, respectively) as does 43% of the general public. Muslims (14%) are as likely as the Jews (15%) and the general public (20%) to support the “Muslim ban.” Compared to 2018 when 13% of Muslims said they supported this policy, Muslims are statistically as likely (14%) to say the same in 2025. Banning people from majority Muslim countries, which President Trump put into law during his first term in a variety of forms (Amnesty International UK, 2025), remains a part of his overall policy platform today in a modified form (Treisman, 2025). This policy has lost support among the American public, at least in its original conceptualization.

Bar graph showing that support for the “Muslim ban” has decreased among Muslims and Jews from 2018 to 2025 but remains steady among the general population, according to an Institute for Social Policy & Understanding survey.

Muslim Men Tend to Be More Supportive of Trump’s Policies than Muslim Women

Across the board, Muslim men are more likely than Muslim women to support the battery of Trump policies included in this survey. The largest gender gap is in men’s (32%) and women’s (12%) support for the creation of the Department of Government Efficiency (DOGE). Two policies share the smallest gap: the displacement of Palestinians from Gaza and the proposed cutting of Medicare and Medicaid, with both having 18% of men and 9% of women supporting the policies. This gender gap is also reflected in the presidential vote where, among Muslims who participated in the vote, 42% of Muslim men and 17% of Muslim women cast their vote for Trump.

A bar graph comparing Muslim men’s and women’s support for eight Trump-era policies, showing men are consistently more supportive than women. Each policy is represented by side-by-side orange and blue bars.

This gender pattern is not unique to Muslims, though it is most pronounced among Muslims. For example, Jewish men (43%) are more likely than Jewish women (21%) to support recognizing two sexes, the expansion of ICE (36% of men, 21% of women), termination of DEI (28% vs. 14%), and reducing the federal work force (28% vs. 14%). For the remaining policies, Jewish men and women are on par, including the minority support for the forced displacement of Palestinians (21% for both), and deportation of student protesters for Palestine (26% vs. 25%).

The gender difference across policies holds for Protestants, Catholics, white Evangelicals, and the general population. Trump enjoys the most support among white Evangelicals, but even in this group, men are more likely than women to support termination of DEI (73% vs. 52%), the creation of DOGE (73% vs. 48%), reducing the federal workforce (75% vs. 53%), and the deportation of students for pro-Palestinian protests (61% vs. 39%).

Notably, the only group in which there is no statistical gender difference at all in support for Trump policies is non-affiliated Americans. Men and women are equally likely to support all policies tested, and support never surpasses 29% on any policy, making this group the least supportive of the platform of any tested.

Muslims and Jews Equally Likely to Oppose Displacement of Palestinians in Gaza and Deportation of Students for Anti-War Protests

Muslims and Jews are roughly similar in their level of support for Trump policies, including issues regarding Gaza, where the two are on par. The stark exception is regarding gender definitions where Muslims (52%) exceed Jews (33%) in their support. The majority of Jews (52%) oppose recognizing two sexes, on par with 48% of the non-affiliated and more likely than 18% of Muslims, 24% of Catholics, 16% of Protestants, and 6% of white Evangelicals.

The majority of Muslims and Jews oppose Trump policies aimed at squashing pro-Palestinian activism and rights, including the displacement of Palestinians from Gaza (63% of Muslims and 52% of Jews oppose) and the deportation of students for pro-Palestinian speech and protests (64% of Muslims and 61% of Jews oppose). Additionally, 55% of those not affiliated with a religious group oppose the forced displacement of Palestinians from Gaza, and 61% oppose the deportation of students who participated in protests against the war in Gaza.

Only 14% of Muslims support the deportation of students for pro-Palestinian speech and proposed displacement of Palestinians in Gaza, which is less than Jews (26% and 21% support each of these policies, respectively). Catholics (27%), Protestants (32%), white Evangelicals (50%), and the general public (24%) are all more likely than Muslims to support the deportation of students who protest the war in Gaza. At 31%, white Evangelicals are also the most likely to support the forced displacement of Palestinians from Gaza, compared to 14% of Muslims, 16% of Catholics, 22% of Protestants, and 17% of the general public. The group least likely to support these policies are not Muslims (10%) but those not affiliated with a religious group (9%).

Majority of Trump Supporters in the General Public Oppose the Displacement of Gazans, on Par with Muslim Trump Voters

We now look at levels of support and opposition to President Trump’s policies by candidate selection in the 2024 presidential election. Are President Trump’s policies overwhelmingly favored by those who voted for him? Is there any support among those who did not vote for him?

When it comes to the two anti-Palestinian policies, Trump voters in the general public (39%) and Muslim Trump voters (46%) are on par with their level of support for the forced displacement of Palestinians from Gaza. Trump voters in the general public are more likely than their Muslim counterparts to support deporting students for pro-Palestinian protests (58% and 45%, respectively). Those in the general public who voted for Kamala Harris (2%) are far less likely to support the forced displacement of Gazans than Muslims who voted for Harris (13%). A July 2025 Gallup poll found that only 8% of Democrats support Israel’s military actions in Gaza, compared to 71% of Republicans and 25% of Independents. Prior to that, a Gallup poll from March 2025 found that, for the first time ever since tracking, Democrats are more likely to express sympathies for Palestinians (49%) than Israelis (38%).

Looking across policies, we find that Trump supporters in the general public are more likely than their Muslim counterparts to support all his policies, with the exception of one. Muslim Trump supporters are more likely than Trump supporters in the general public to support the proposed cutting of Medicare and Medicaid (44% vs. 21%, respectively).

When It Comes to Policies Related to Palestine, Muslims Who Voted Third Party Trend with Harris Voters in the General Public

Digging deeper, we find that Muslim Harris voters are far more likely than their counterparts in the general public to support all of Trump’s policies, including the least popular ones like cutting Medicare and Medicaid (9% vs. 1%, respectively) and the forced displacement of Palestinians from Gaza (13% vs. 2%, respectively).

Rather, we found that Muslims who voted for a third-party candidate, namely Jill Stein, are more in line with Harris voters in the general public when it comes to support for President Trump’s policies. Specifically, 1%–13% of Harris voters in the general public express support for the various Trump policies, in line with 2%–13% of Muslims who voted outside of the two-party candidates. A notable exception was President Trump’s policy to recognize only two sexes, male and female, with 18% of general public Harris voters supporting it compared to 57% of Muslims who voted third party, although the difference was not statistically significant.

A table displays survey results on American and Muslim 2024 presidential vote preferences and opinions on Gaza-related and federal policies, showing percentage support for each policy by candidate preference.

Downloads

Read the full report of ISPU’s American Muslim Poll 2022. American Muslim Poll 2022: A

August 23, 2022

Read the key findings of ISPU’s American Muslim Poll 2022. American Muslim Poll 2022: A

Did You Know?

ISPU’s survey of American Muslims, Jews, Catholics, Protestants, and the non-affiliated is one of a kind, offering the latest trends and demographic data on American Muslims. And every year, we rely on individuals like you to keep this research free and accessible to all. Right now, we need your help to keep it that way, so that millions can remain informed on the topics that matter the most. If you value the reliable data our poll provides, consider making a donation—big or small—in support of ISPU’s American Muslim Poll. It only takes a minute. Thank you.

Support American Muslim Poll