
The following demographic profile of American Muslims provides important context before delving into specific family-related topics. These demographics are discussed in detail in ISPU’s American Muslim Poll 2022: A Politics and Pandemic Status report.
Despite a myriad of factors that contribute to home ownership becoming less and less attainable for Americans, the purchase of a home is still valued as a pinnacle moment in the American experience. According to a report from the National Association of Realtors (NAR), in 2024, the average age of first time-home buyers in the U.S. reached an all-time high of 38. Average age at first marriage (30.2 for men and 28.6 for women) and first birth for women (27.3) also continue to rise. For those not in a position to buy a home, the cost of rent is at an all-time high. The implication is that Americans must choose to embark on homeownership, or continue to face higher and higher rent prices, as they are raising families and possibly also caring for aging parents.
In the American Muslim Poll 2022, ISPU surveyed Americans on home ownership and renting for the first time. We found that slightly more than half of Muslims (53%) report owning their home, on par with 57% of the general public and 49% of those not affiliated with a religious group. Muslims are less likely than Jews (66%), Catholics (67%), Protestants (70%), and white Evangelicals (66%) to own their home.
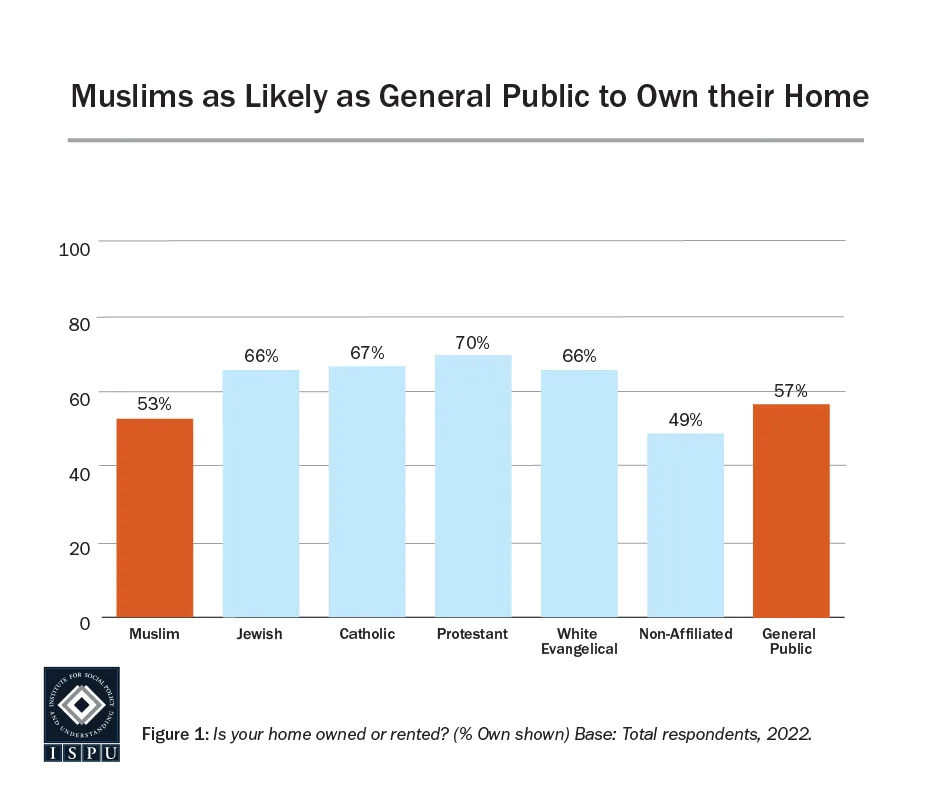
Age and marital status of Muslims may be given as possible explanations for the disparity in home ownership between Muslims and members of other religious groups, given that Muslims are younger and more likely to be single than all other groups surveyed. The sample sizes for these groups do not allow for age breakdowns. However, for both Muslims and the general public, we find that the proportion who own their home increases with age. Upon closer examination, we find that Muslims ages 18-29 are more likely than 18-29 year olds in the general public to own their home (45% vs 29%, respectively) but that Muslims ages 50 and older are less likely than 50+ year olds in the general public (61% vs. 76%, respectively). Fifty-six percent of Muslims ages 30-49 own their home, on par with 49% of the general public in the same age cohort.

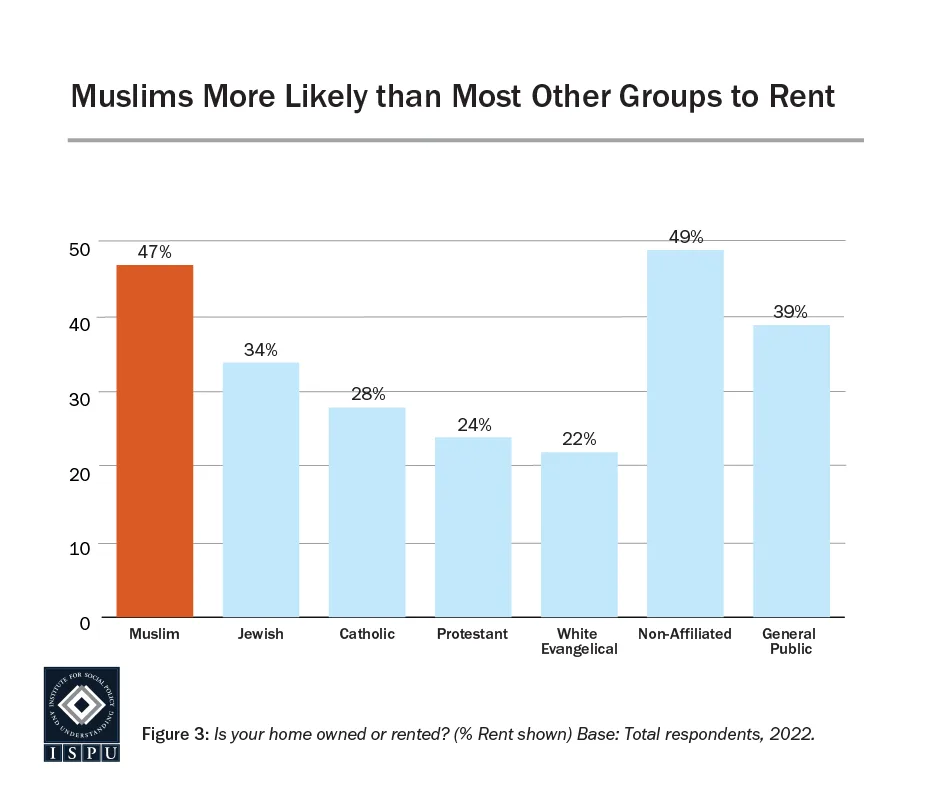
Nearly half of Muslims (47%) rent their current home, on par with 49% of the non-affiliated, but more likely than Jews (34%), Catholics (28%), Protestants (24%), white Evangelicals (22%), and the general public (39%). Muslim women (55%) are more likely than Muslim men (40%) to be renters. No other religious groups have a gender disparity in the proportion who rent. When looking by age, we find that Muslims aged 18-29 are statistically as likely as their age peers in the general public to rent (55% and 68%, respectively). The same pattern holds true for 30-49 year olds (43% and 48%, respectively). On the other hand, Muslims ages 50 and older are much more likely than people in the general public ages 50 and older to rent (39% vs. 19%).
This pattern may be explained by the fact that an older generation of Muslims may have not had Islamic financing options available when they were looking to purchase a home with young families–options that are now much more accessible. Older adults may prefer to rent rather than buy a home for the first time in their retirement years.
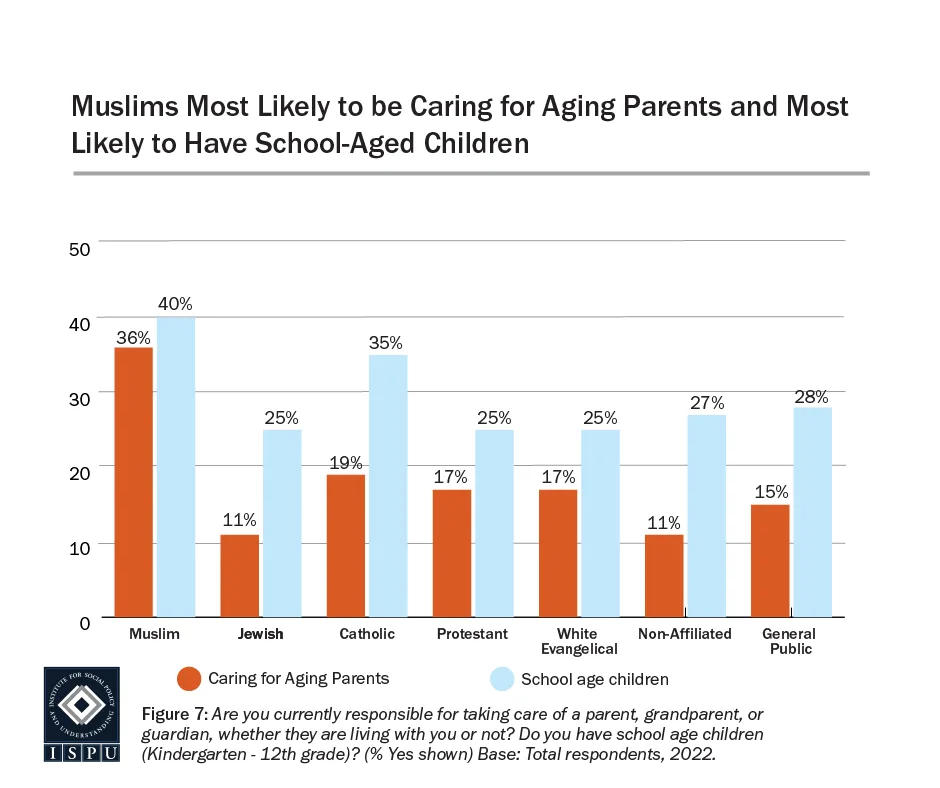
Another salient issue facing American families today is their children’s education. We find that 40% of Muslims report having school-aged children (K-12). This is more likely than 25% of Jews, 25% of Protestants, 25% of white Evangelicals, 27% of the non-affiliated and 28% of the general public. Only Catholics (35%) are on par with Muslims when it comes to having school-aged children.
Within one household or family, there may be children who are educated differently than their siblings. We report on the percent of Muslim parents who have at least one child in each of these various schooling options. Sample sizes only allow for comparisons with Jews and the general public.
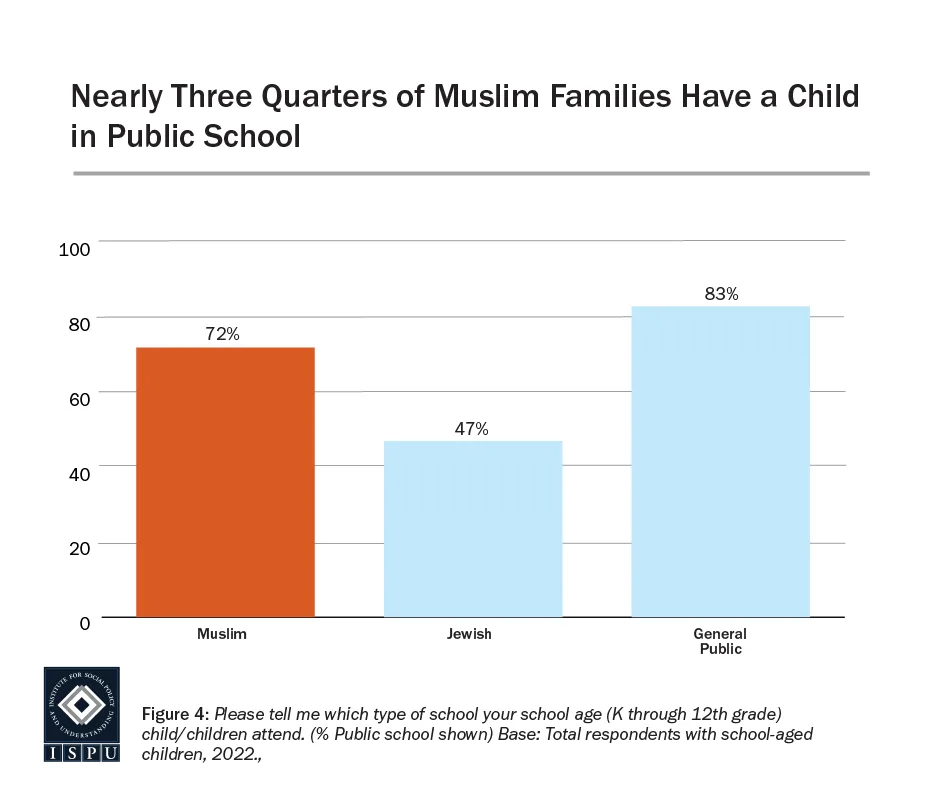
The majority of Muslims families (72%) send at least one child to public school, which is less likely than 83% of the general public, but more likely than Jewish (47%) families. With the majority of Muslim children of school age attending public school, it is important that public schools are made to be safe places for their growth and development. As previously reported, roughly half (48%) of Muslim families with children in K-12 grade school report that their child or children experienced some frequency of religious-based bullying in the previous year. Public schools should be inclusive and safe from religious-based bullying or other forms of bigotry.
Nearly a quarter of Muslim families with school-aged kids send at least one child to a private religious school associated with their religions group, i.e. Islamic schools (23%). This is more likely than 6% of the general public who send a child to a religious school associated with their own religious group. At 44%, Jewish families are the most likely to send a child to a religious school associated with their own religious group.

Private religious schools associated with a religious group different from one’s own religious group are another schooling option for families. Slightly more than one in ten Muslim families (11%) send at least one child to a religious school not associated with their faith community, which is more likely than 2% of the general public. Among private schools, there is also the secular, non-religious option. Muslims (11%) are more likely than the general public (1%) to send at least one child to a non-religious private school.
This adds up to 22% of Muslim families opting to send at least one child to a private school that is not an Islamic school. This may imply that Islamic schools have the potential to gain an additional 22% of Muslim families that can pay for a private school but are choosing not to send their children to private Islamic schools. Perhaps as Islamic schools develop and grow in professionalism, performance, and prestige they will gain more of this private school Muslim market share.
Further exploration is needed into the potential barriers to accessing Islamic schools among families wishing to do so. Some of these barriers may include cost, location/distance, resources to meet the needs of diverse learners, and more.
Just six percent of Muslim families homeschool at least one of their K-12 school-aged children, on par with five percent of Jews and 10% of the general public. Nationally, the percent of homeschooled children has risen since 1999, with significant growth during the pandemic. Additional research is needed into the particular motivations and experiences of Muslim homeschool families.

For the sandwich generation, the other side of the experience is caring for aging parents. Muslims (36%) are more likely to be responsible for the care of a parent, grandparent, or guardian than any other group (11%-19%). The proportion of Muslim men (39%) and Muslim women (32%) who are caring for an elder is statistically on par. As expected, Muslims between the ages of 30-49 (52%) are more likely than those ages 18-29 (21%) and 50+ (31%) to be caring for elders.
This research calls attention to several needs facing Muslim families: