In our survey, we employed the NORC at the University of Chicago standard gender question with response options of male or female. More than half (56%) of Muslims in the U.S. are male, compared to 44% who are female. This is on par with all other groups except the general public, which is 48% male and 52% female.
As previously reported in 2017 and 2022, American Muslims are younger than all other religious and non-religious groups. Roughly one quarter of Muslims in the U.S. (26%) are between the ages of 18 and 24. This is in comparison to 15% of Jews, 12% of Catholics, 5% of Protestants, 7% of white Evangelicals, 14% of those not affiliated with a religious group, and 10% of the general public.

The younger average age of American Muslims has several important implications. It means Muslims are more likely to be active in the workforce and contribute to tax revenues. Additionally, because a greater portion of the community is in their childbearing years, the population is expected to grow more rapidly than older groups with fewer births. For many young American Muslims, this also means they’ve grown up entirely in the post-9/11 era—a time when their religious community has frequently faced scrutiny, securitization, and stereotyping. The relatively younger age of American Muslims also has implications for media consumption. The Pew Research Center finds that the highest levels of social media use are among the youngest cohorts of adults surveyed (ages 18–29) and usage decreases among older age groups (Auxier & Anderson, 2021). Given the current context around student protest crackdowns and federal inquisition of higher education institutions, Muslims between the ages of 18 and 24 who are students stand to face a direct impact to their education and careers.


When it comes to income, 35% of Muslims have a household income of $30,000 or less, which is more likely than 11% of Jews, 19% of Catholics, 20% of Protestants, 21% of white Evangelicals, and 20% of both the non-affiliated and the general public. On the other end of the spectrum, roughly one quarter of Muslims (24%) have a household income of $100,000 or more, which is on par with most other groups but less likely than 48% of Jews.

White Muslims are more likely than Black and Arab Muslims to have a household income of $100,000 or more (44% vs. 7% and 19%, respectively). Additionally, Asian Muslims (34%) are more likely than Black Muslims (7%) to have this level of household income.
Despite being younger, 36% of Muslims hold a bachelor’s degree or higher, on par with 36% of the general public, 30% of Catholics, 37% of Protestants, and 42% of the non-affiliated. Muslims are less likely than Jews (59%) to hold a college degree or higher.

At the time our poll was fielded, 47% of Muslims reported being a current student, more likely than 12% of Jews, 15% of Catholics, 6% of Protestants, 6% of white Evangelicals, 13% of the non-affiliated, and 11% of the general public. We define student as someone who is in a four-year degree program, graduate school, a two-year associate’s program, or technical training. Among Muslims, 26% are in a four-year degree program, 14% are in graduate school, 4% are in a two-year associate’s program, and 2% are in technical training. Given the younger age of Muslims, we would expect a higher proportion of Muslims to be current students. Among Muslims, Asian (54%), Arab (62%), white (30%), and Black Muslims (31%) are more likely than the general public (7%) to be college or graduate students . Given current national attention on limiting freedom of speech on college campuses, cuts in federal spending on higher education, and immigration crackdowns on international students, we are likely to see disproportionate impacts on Muslim students (Singh, 2025; American Council on Education, 2025).

Seven in 10 Muslims are employed (70%), which is more likely than 57% of Protestants, 52% of white Evangelicals, and 61% of the general population. Muslims are as likely as Jews (67%), Catholics (65%), and the non-affiliated (63%) to be employed. Eight percent of Muslims are self-employed, on par with 6%–11% of all other groups. For employed Americans across the U.S., as well as those seeking employment, a reduction in the federal workforce and federal funding, in addition to the employment impacts of AI, loom large. Given the younger age of Muslims in the U.S., it is expected that they are least likely to be retired (6% of Muslims vs. 10%–30% of all other groups).


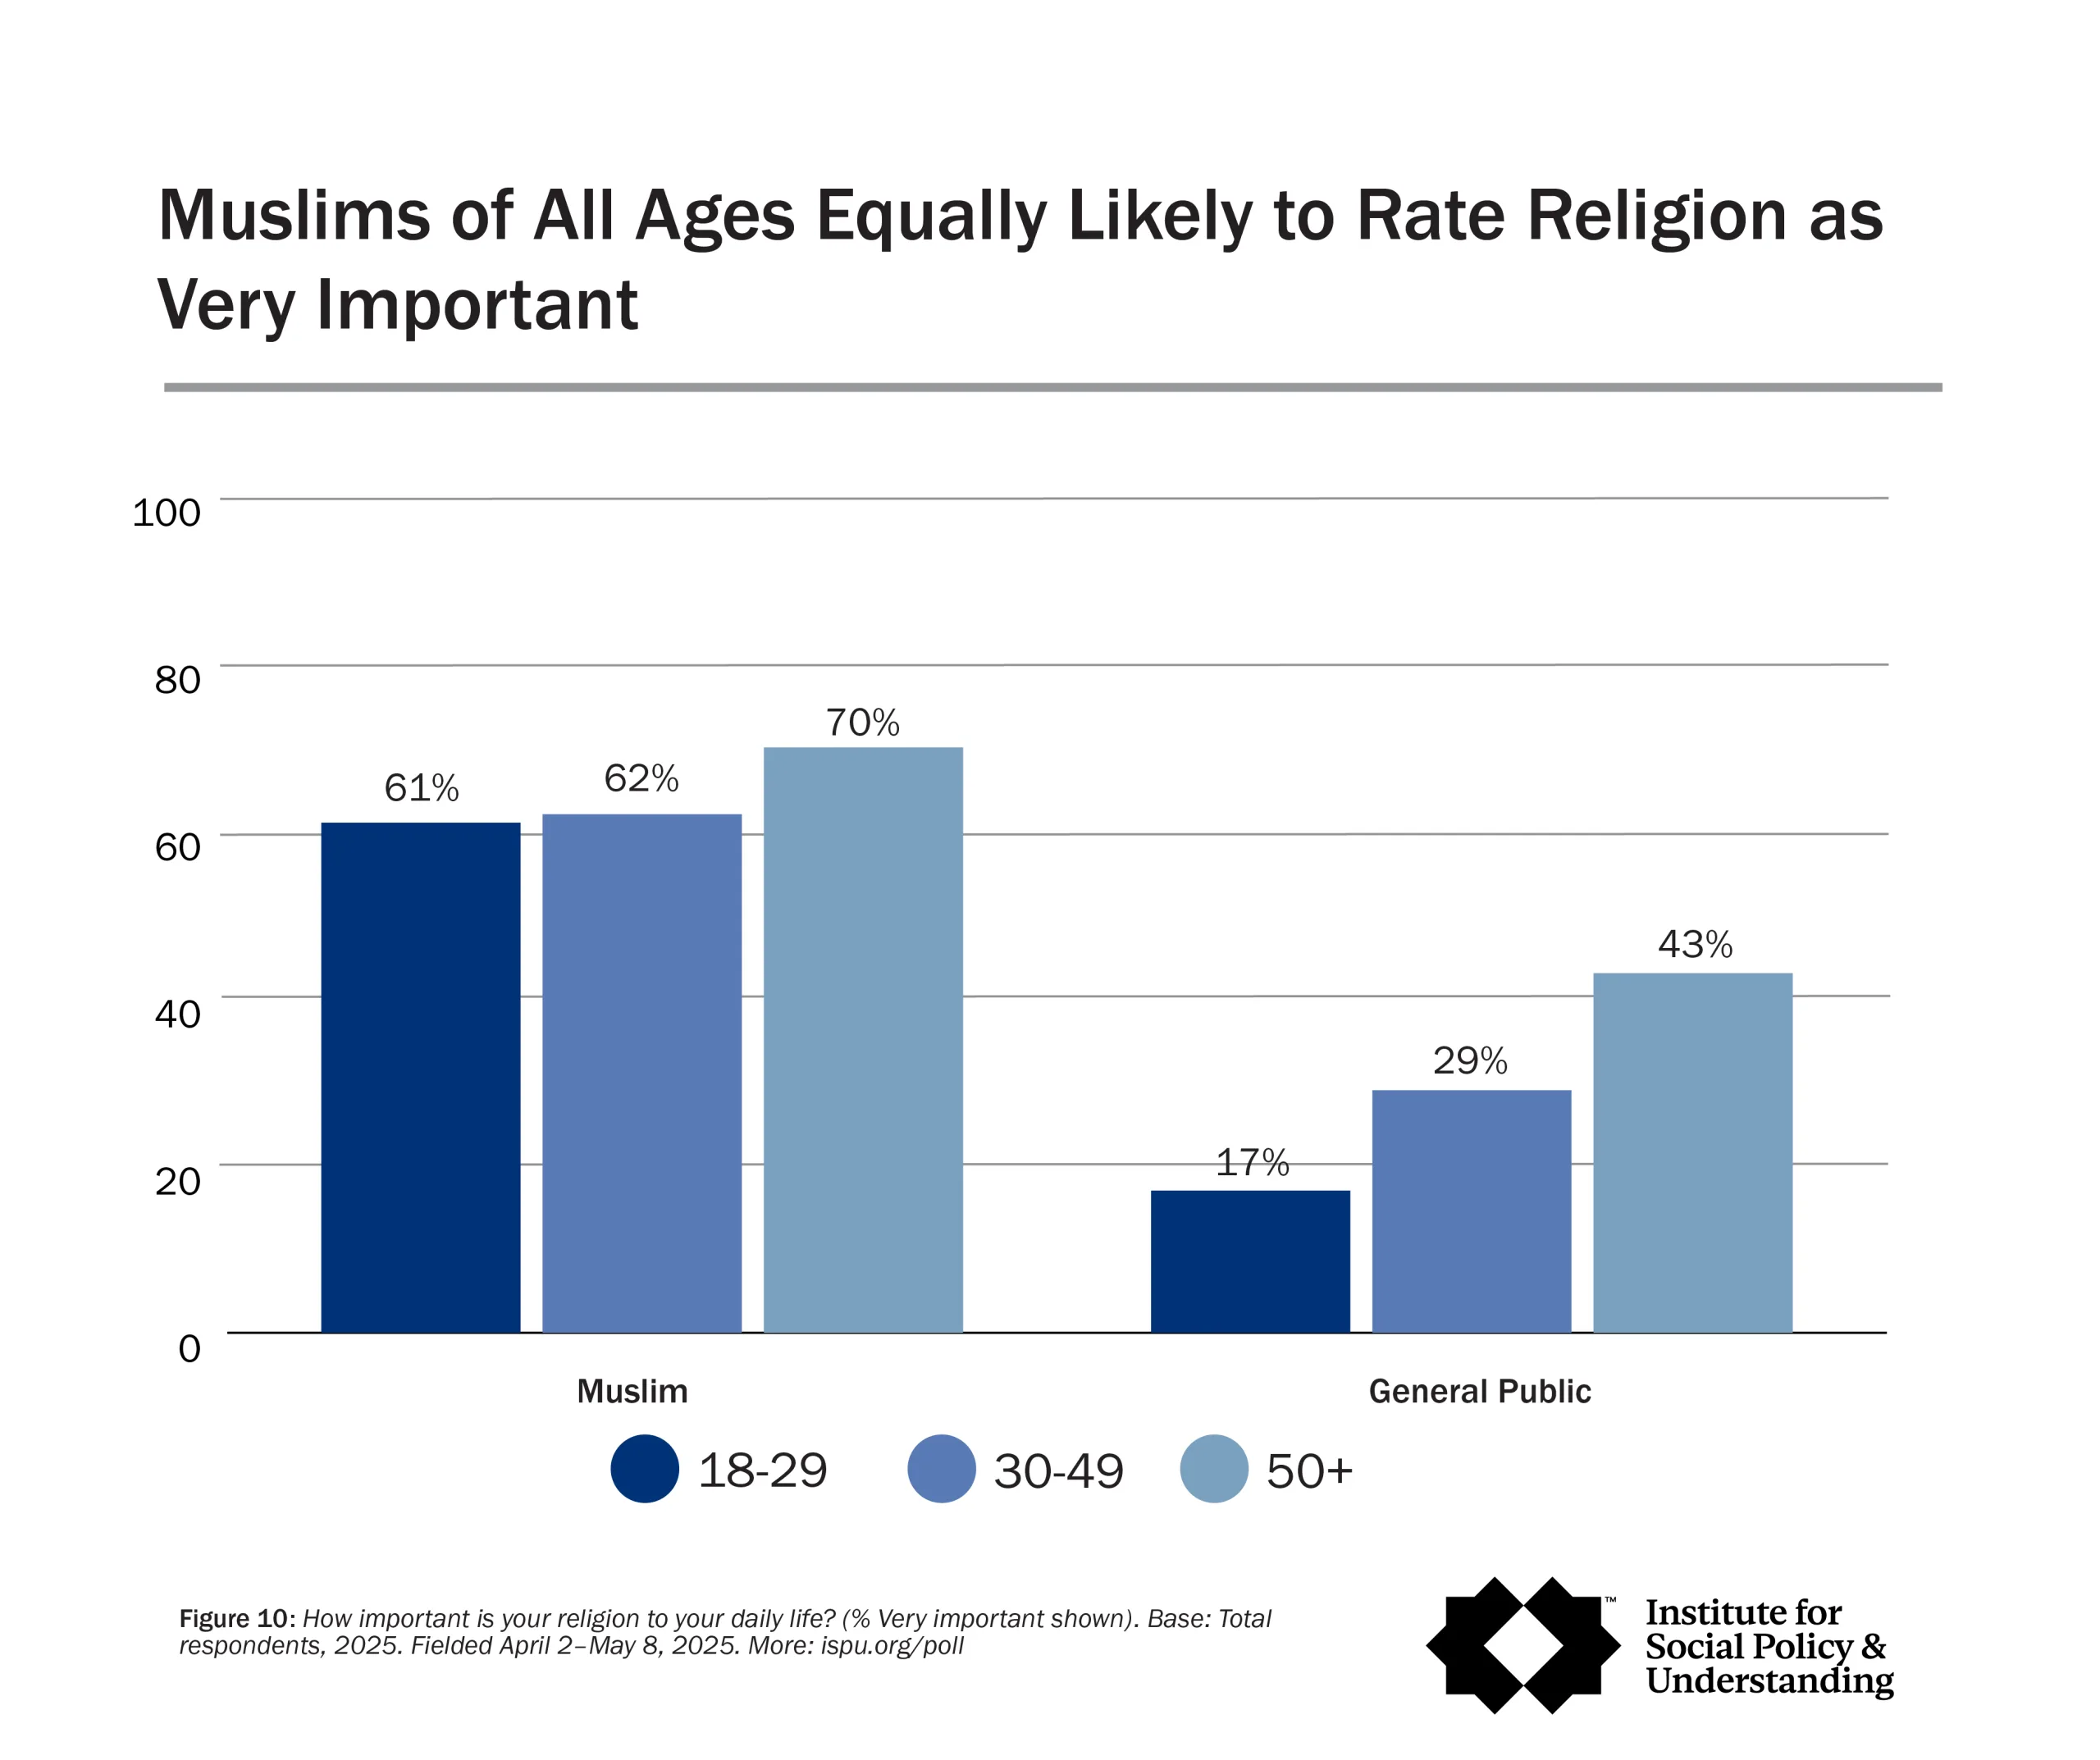
As found in all prior American Muslim Polls, Muslims of all ages are equally likely to rate religion as very important to daily life. This includes 61% of 18-to-29-year-olds, 62% of 30-to-49-year-olds, and 70% of Muslims ages 50+. On the other hand, among the general public, rating religion as very important differs by age, with older people being the most likely (17% of 18-to-29-year-olds, 29% of 30-to-49-year-olds, and 43% of those 50+).
Nearly three quarters, 73%, of Arab Muslims rate religion as very important, which is on par with 57% of white Muslims, 66% of Black Muslims, and 60% of Asian Muslims. White Muslims are more likely than their racial counterparts in the general public (33%) to say that religion is very important to their daily lives.