The final sample included 674 participants, with 330 men, 340 women, and 4 participants who chose another gender identification or preferred not to respond. Participants ranged in age from 18 to 84, with a majority of participants being 25–34 (24%), 45–54 (23%), and 55–64 (18%). Racially, the sample was predominantly white (73%). In terms of education, the majority of participants carried a four-year college degree (45%). Regarding religion, the majority of participants identified as Christian (51%) followed by agnostic (21%). Participants rated how much they identify as a member of their religious group on a scale from 1 (not at all) to 5 (a great deal). The average score, M = 2.66, SD = 1.41, is below the midpoint of the scale, indicating that participants were less identified with their religion overall.b Moreover, participants reported their political orientation on a scale from 1 (very liberal) to 5 (very conservative). The average score, M = 2.63, SD = 1.27, is below the midpoint, indicating that participants trended more liberal overall. The vast majority of participants were born in the U.S. (94%) and were U.S. citizens (99%). (See Appendix A for additional demographic information.)
To analyze the data, we compared responses of participants who viewed the positive depiction of Muslims (9-1-1: Lone Star, season 1, episode 3) and the negative depiction of Muslims (Criminal Minds, season 2, episode 10) on all the outcome measures. We used linear regression models to test the effects of experimental conditions on the outcomes. Specifically, we used a statistical method called orthogonal contrast analysis to determine if there were differences in outcomes on our survey measures (e.g., anti-Muslim policy support) between participants who viewed positive versus negative depictions of Muslims. This method tests whether the effect of exposure to one depiction versus another on a given outcome measure are statistically significant, which is to say that differences in participants’ scores on that outcome measure after being exposed to one video versus another are so large that they likely did not appear by chance. (See Appendix A for additional information about the analyses conducted.) A significant result from these analyses means that the difference between conditions is deemed “significant” or “statistically significant” if the p–value statistic is less than 0.05. All models were conducted with and without controlling for participant age, sex, race, and political orientation. The direction and significance level of all models remained constant across all of the analyses. As such, the results reported below are the simpler models without the control variables.
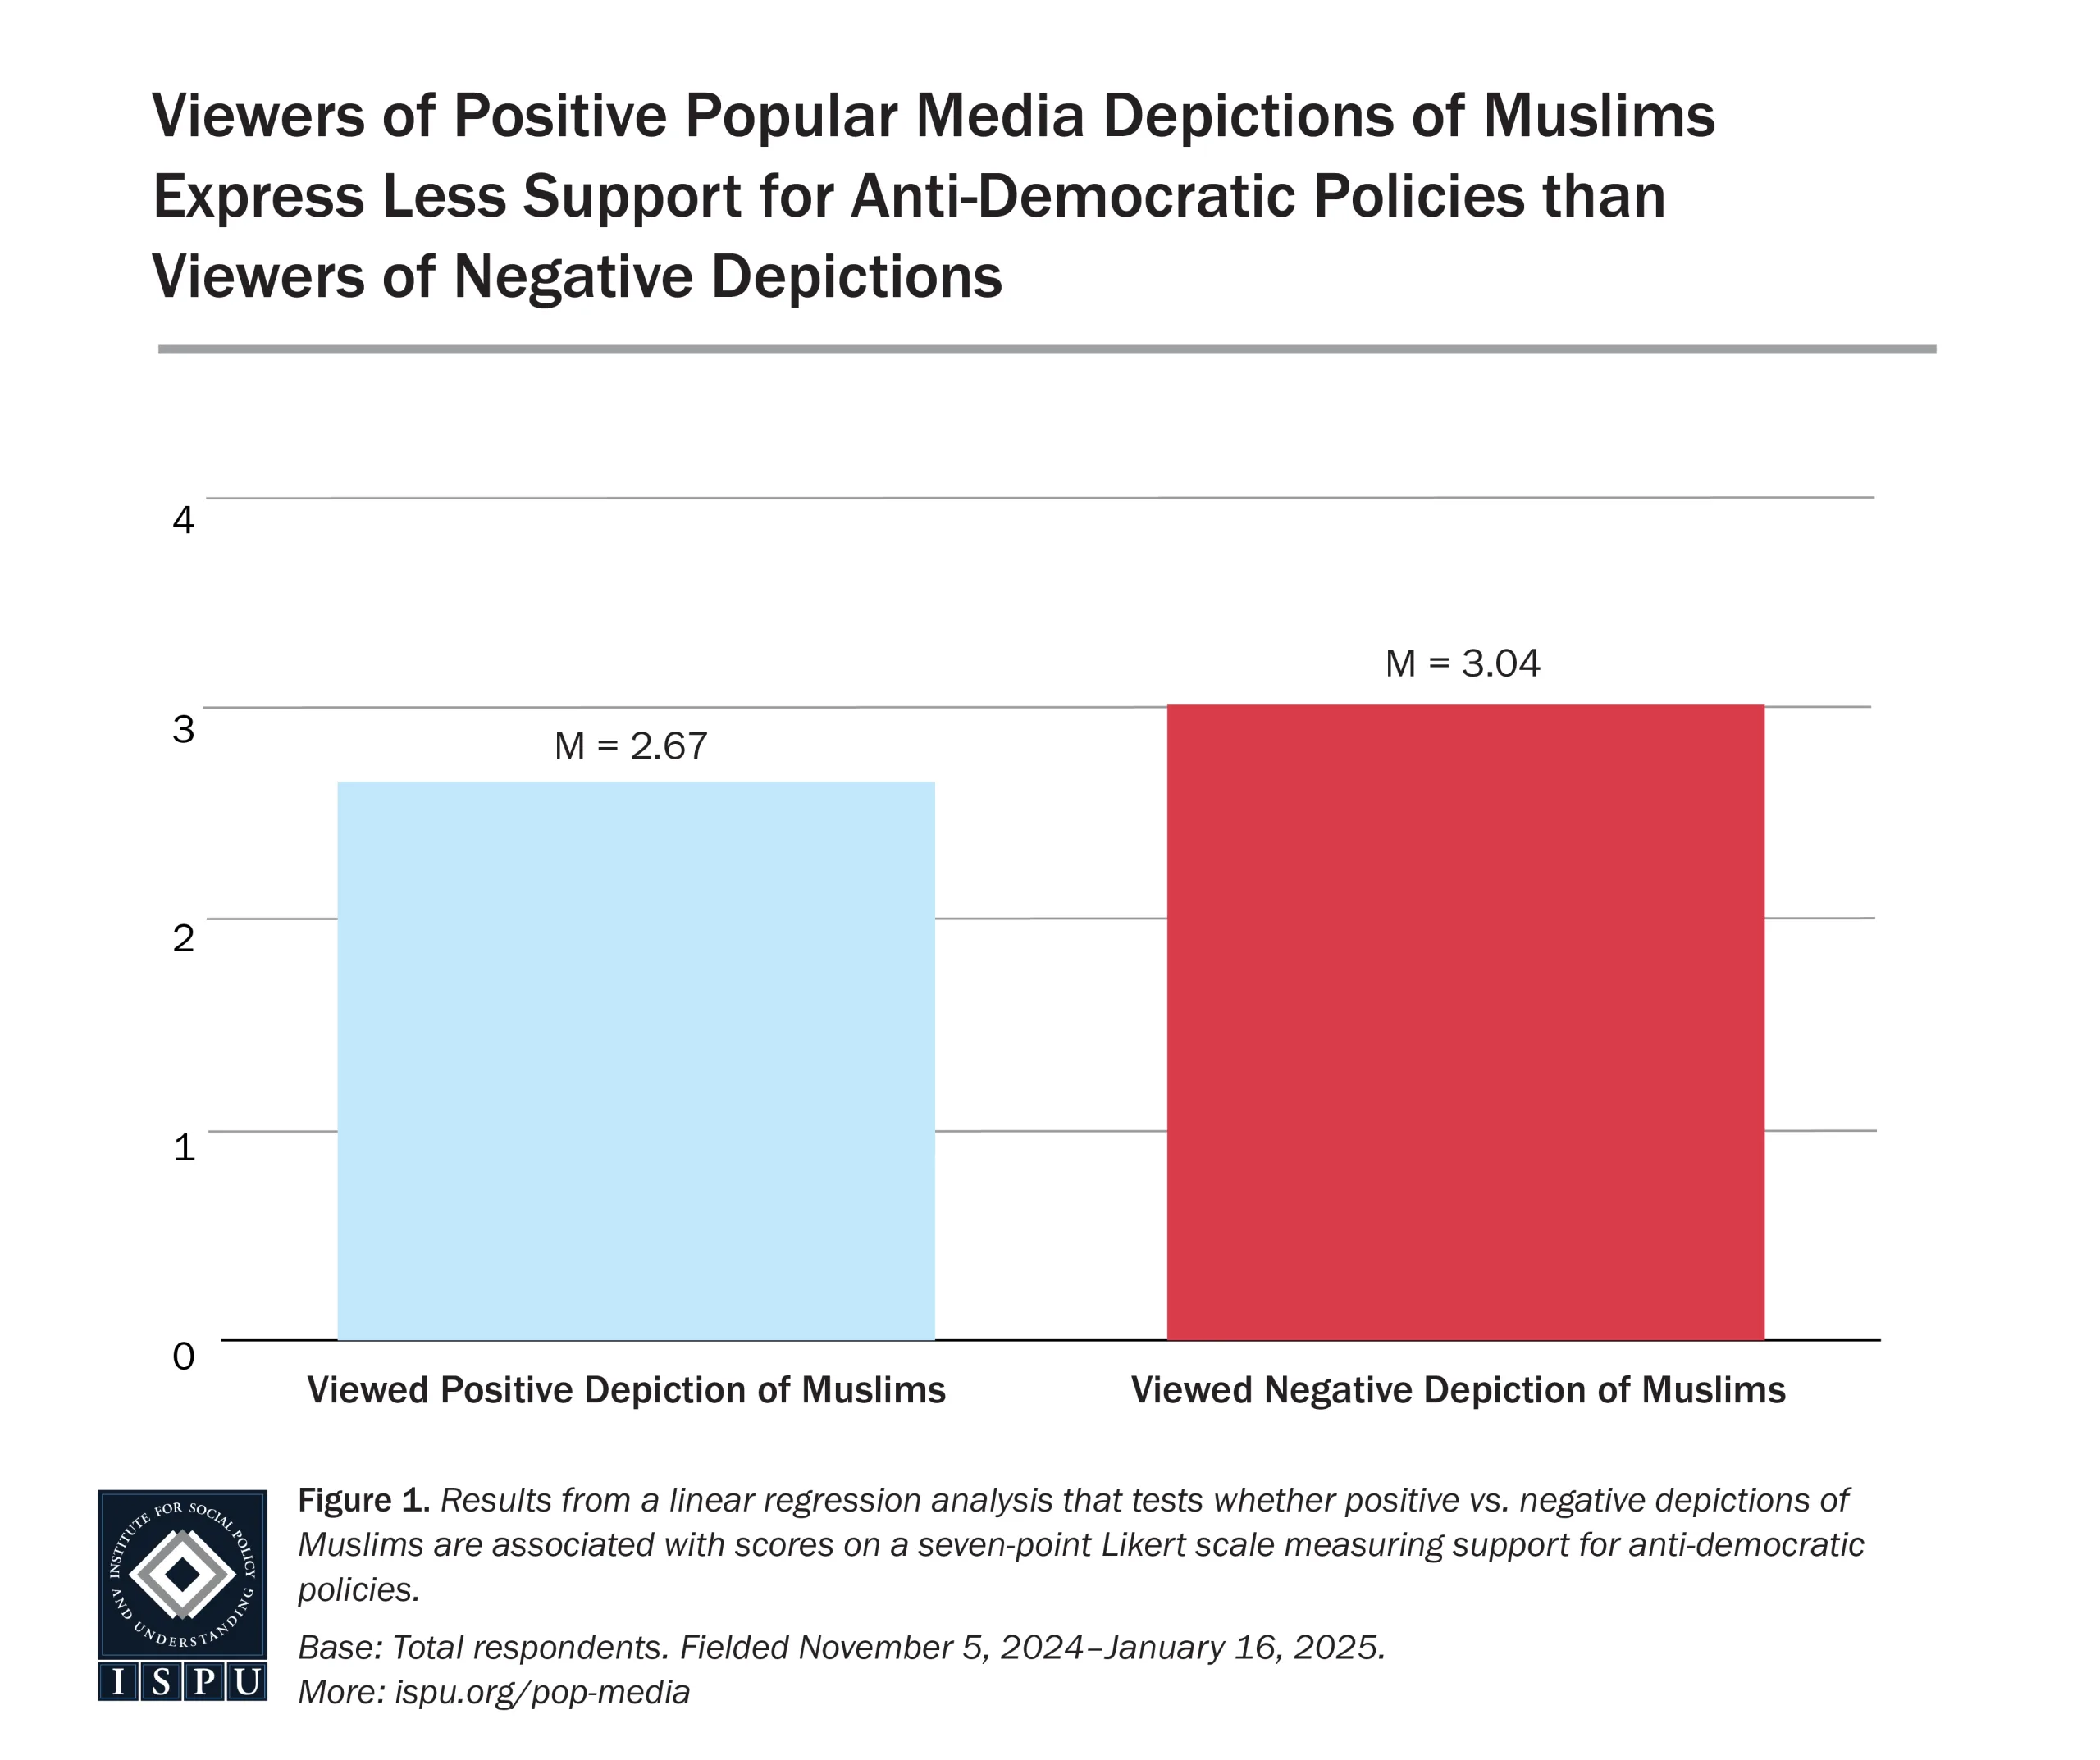
A linear regression with a primary contrast comparing the positive Muslim representation to the negative Muslim representation showed that responses of those who viewed the positive Muslim representation were significantly lower (M = 2.67, SD =1.45) than responses of those who viewed the negative Muslim representation (M = 3.04, SD = 1.53). That is, those who watched the positive representation of Muslims showed more opposition to anti-democratic policies than those who had watched the negative representation.c
The primary contrast comparing the positive Muslim representation to the negative Muslim representation showed that those who viewed the positive Muslim representation (M = 2.10, SD = 1.26) were significantly more opposed to anti-Muslim policies compared to those who viewed the negative Muslim representation (M = 2.32 , SD = 1.28).d

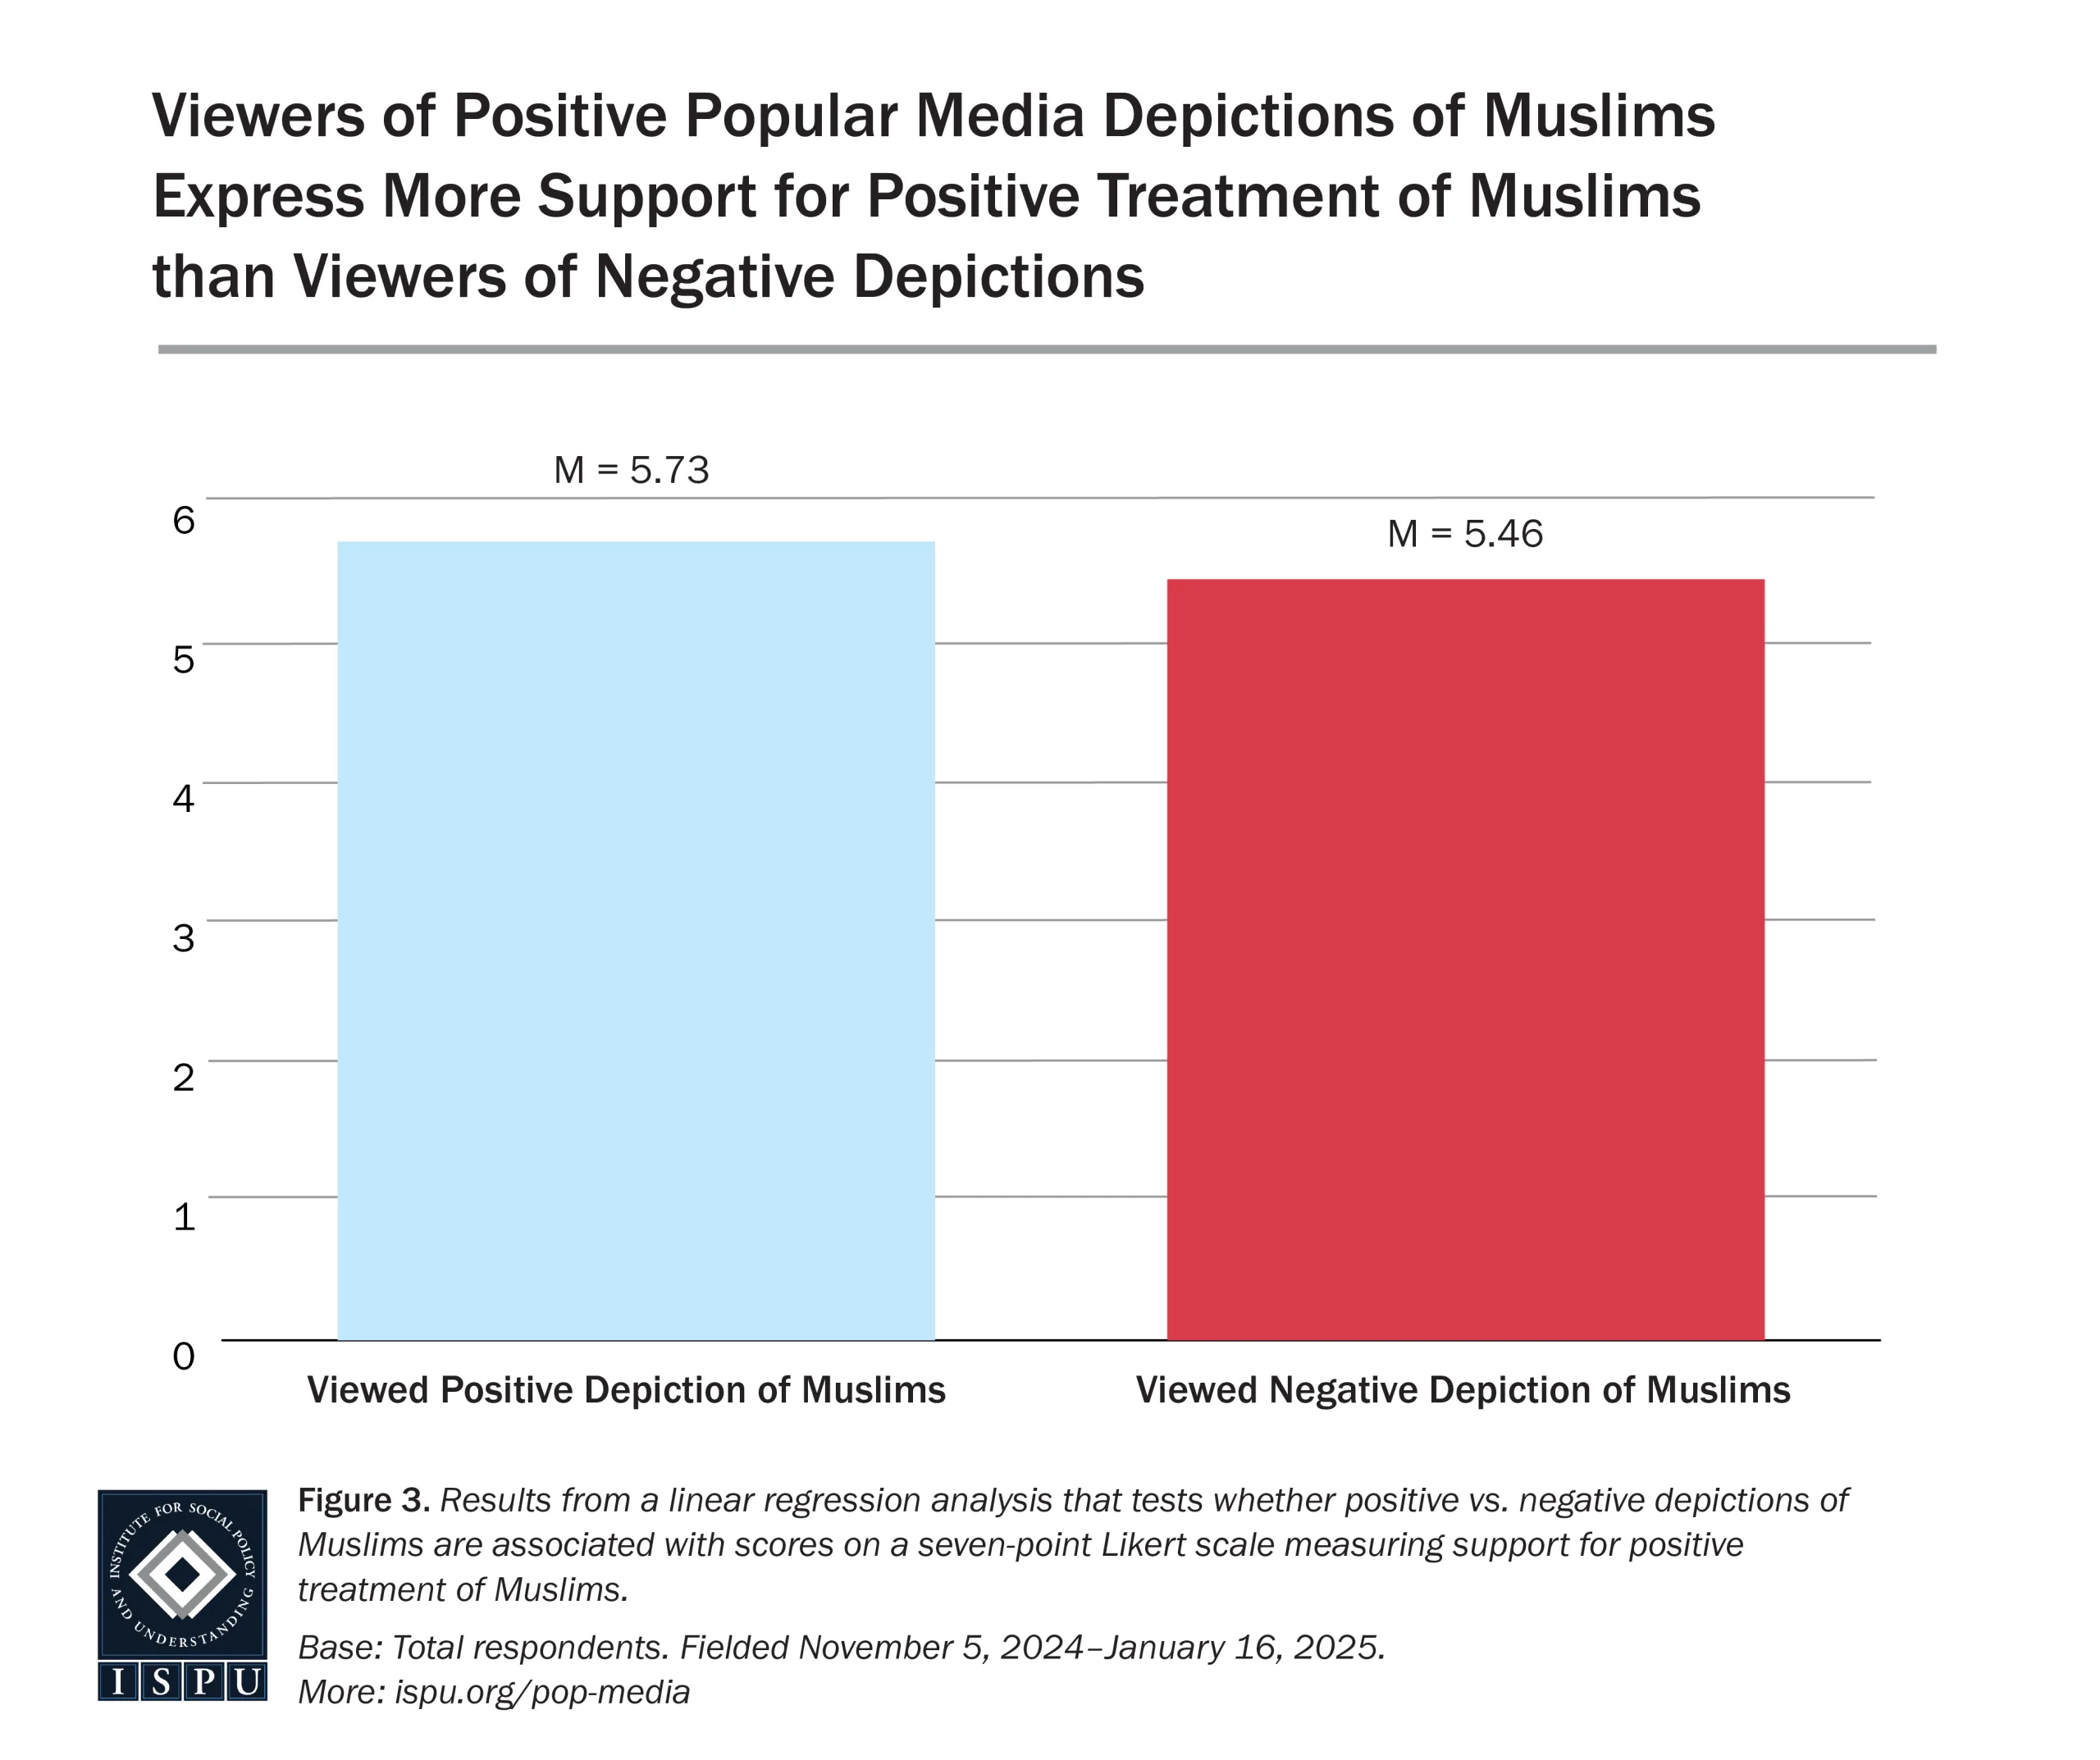
The primary contrast comparing the positive Muslim representation to the negative Muslim representation showed that those who viewed the positive Muslim representation were significantly more supportive of positive treatment of Muslims (M = 5.73, SD = 1.30) when compared to those who viewed the negative Muslim representation (M = 5.46, SD = 1.37).e
The primary contrast comparing the positive Muslim representation to the negative Muslim representation showed that those who watched the positive representation (M = 1.78, SD = 1.09) had significantly lower desires to socially distance themselves from Muslims compared to those who watched the negative representation (M = 2.14, SD = 1.37).f

The primary contrast comparing the positive Muslim representation to the negative Muslim representation showed that intergroup anxiety toward Muslims among viewers of positive (M = 2.19, SD = 0.77) versus negative (M = 2.34, SD = 0.69) Muslim representations were not statistically significant.g

The primary contrast comparing the positive Muslim representation to the negative Muslim representation revealed that those who viewed the positive Muslim representation (M = 65.02, SD = 22.47) reported significantly higher warmth toward Muslims compared to those who viewed the negative Muslim representation (M = 60.34, SD = 23.62).h

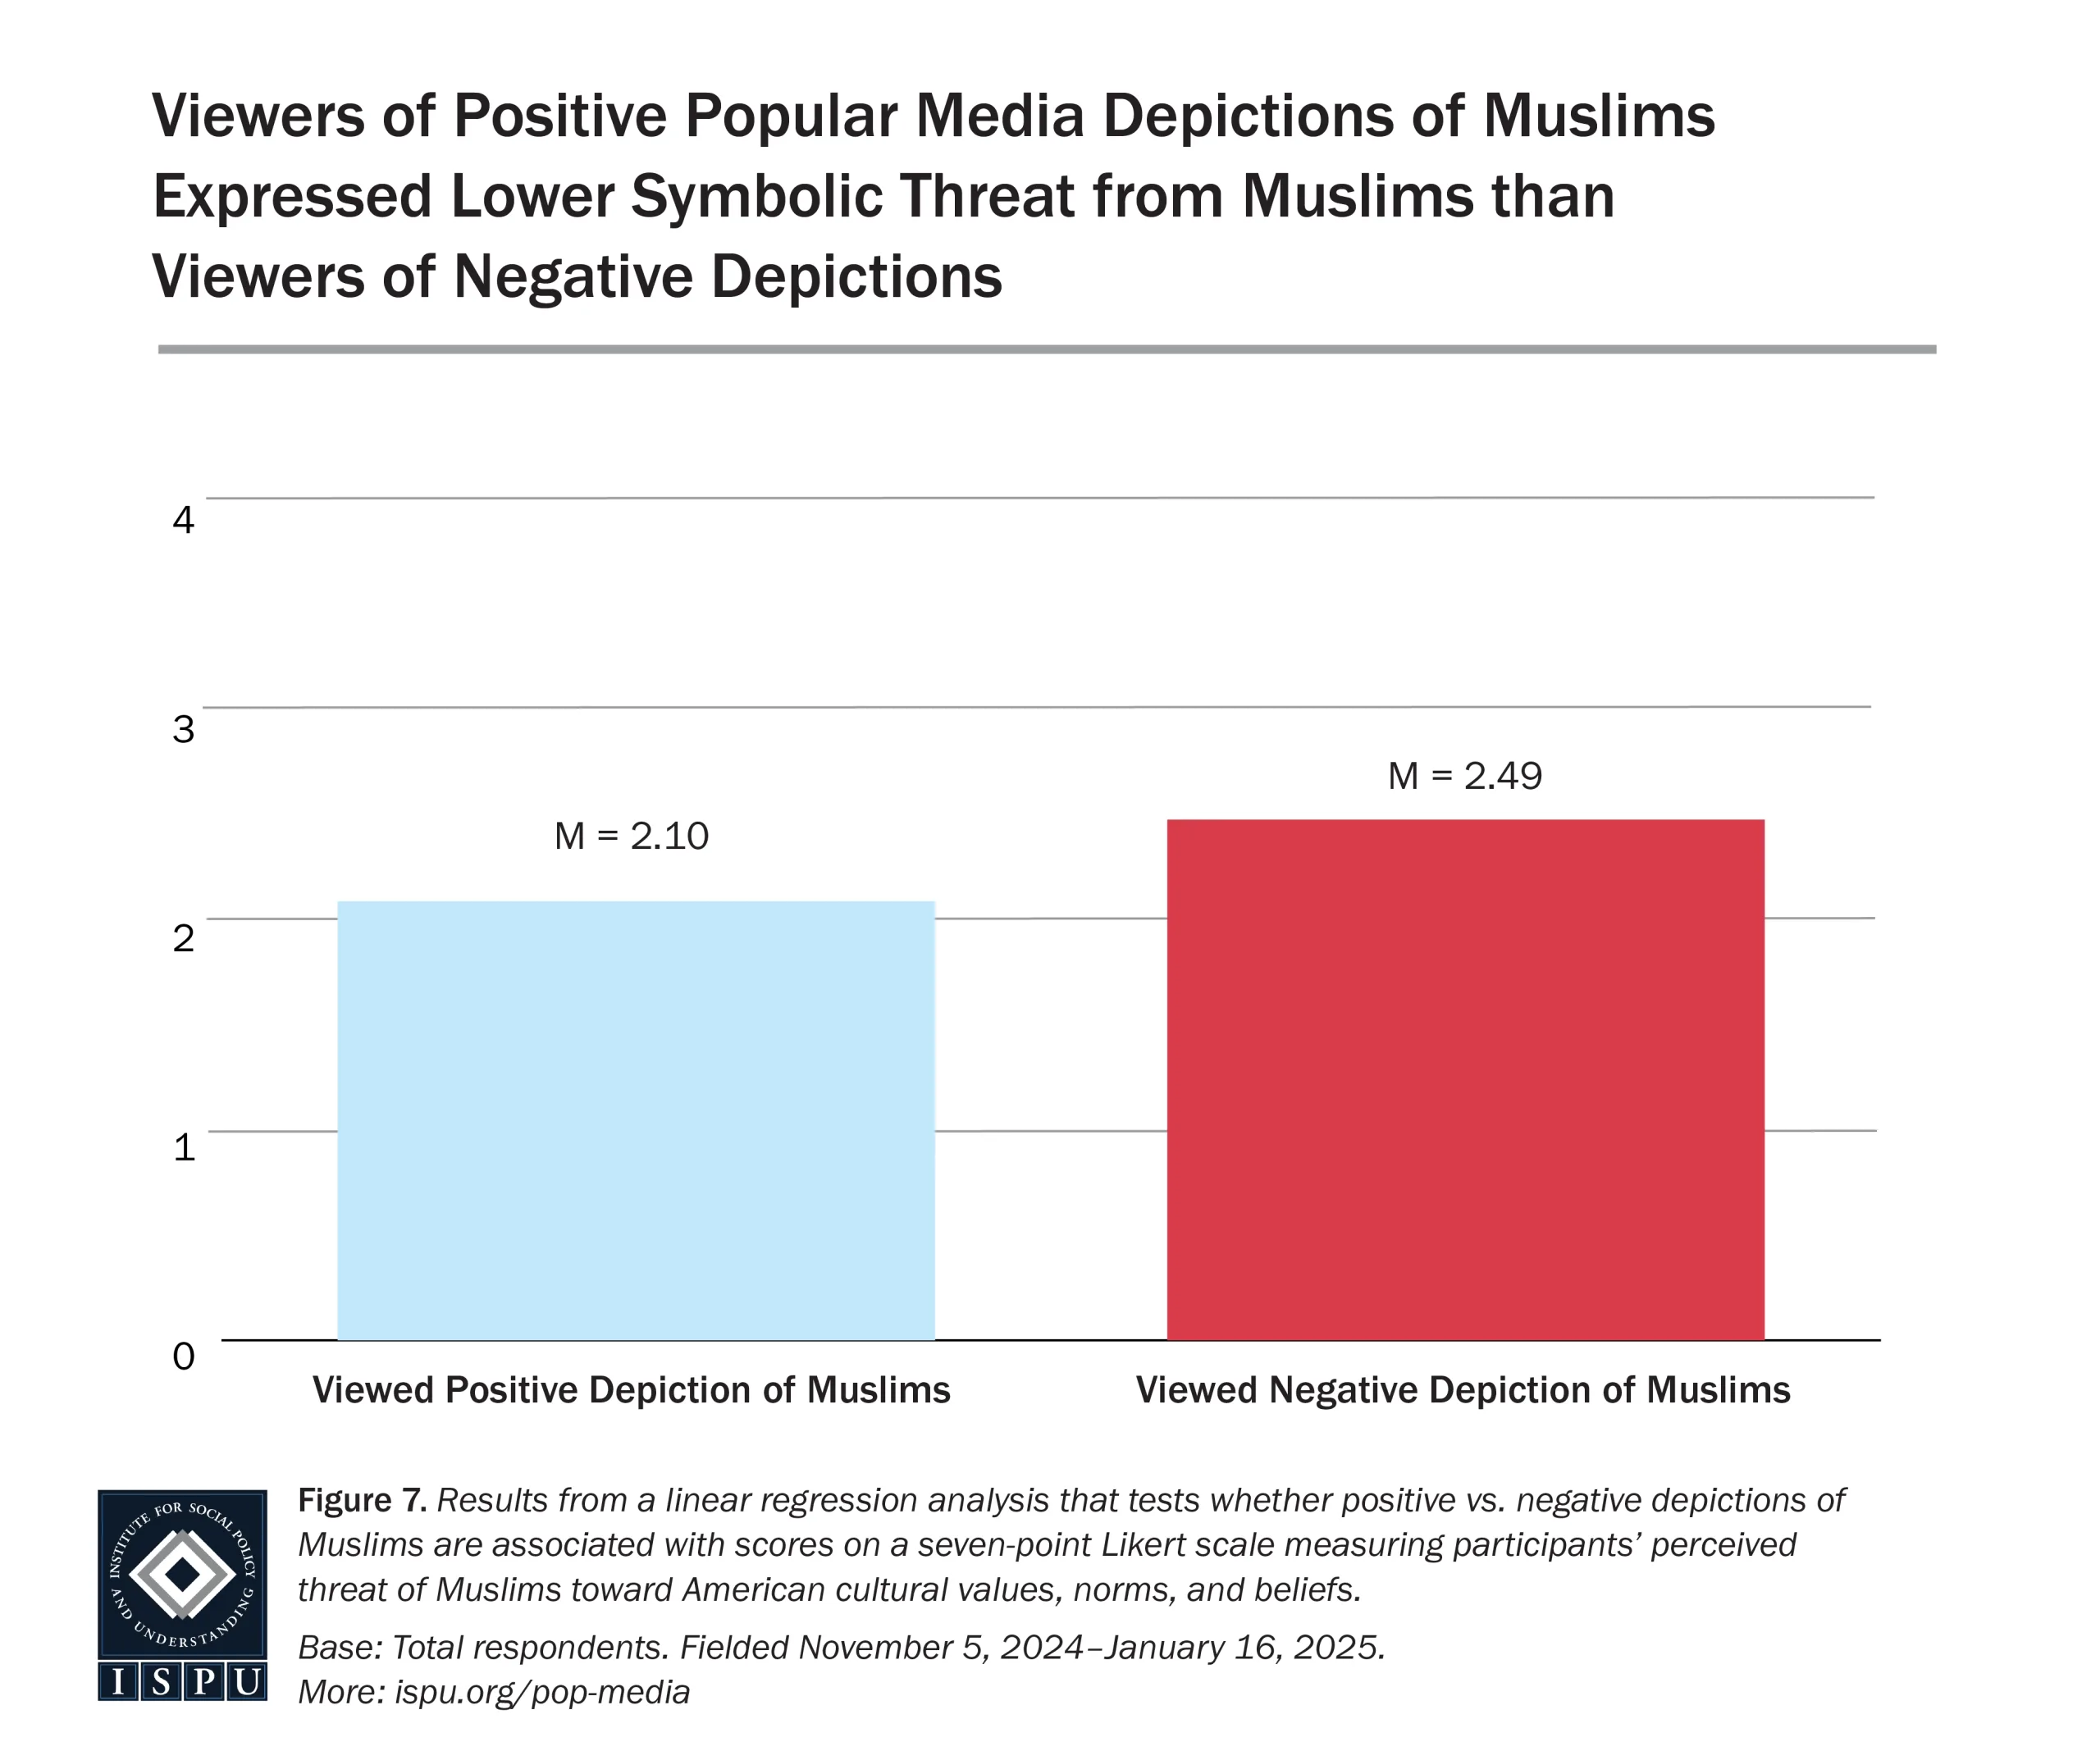
The primary contrast comparing the positive Muslim representation to the negative Muslim representation showed that those who viewed the positive Muslim representation (M = 2.10, SD = 1.44) reported significantly lower symbolic threat from Muslims compared to those who viewed the negative Muslim representation (M = 2.49, SD = 1.65).i
The primary contrast comparing the positive Muslim representation to the negative Muslim representation showed that those who viewed the positive Muslim representation (M = 41.13, SD = 21.13) were significantly more identified with Muslims compared to negative representation viewers (M = 35.33, SD = 19.40).j

The primary contrast comparing the positive Muslim representation to the negative Muslim representation revealed that Islamophobia scores did not differ significantly between those who watched the positive (M = 2.29, SD = 1.23) and those who watched the negative (M = 2.42, SD = 1.24) representation.k

The primary contrast comparing the positive Muslim representation to the negative Muslim representation revealed that positive Muslim representation viewers (M = 5.58, SD = 1.44) did not score significantly differently than negative representation viewers (M = 5.50, SD = 1.46) on pro-diversity beliefs.l

The primary contrast comparing the positive Muslim representation to the negative Muslim representation demonstrated that those who had seen the positive representation (M = 1.44, SD = 0.99) and those who had seen the negative representation (M = 1.59, SD = 1.05) did not score significantly differently on passionate hate.m

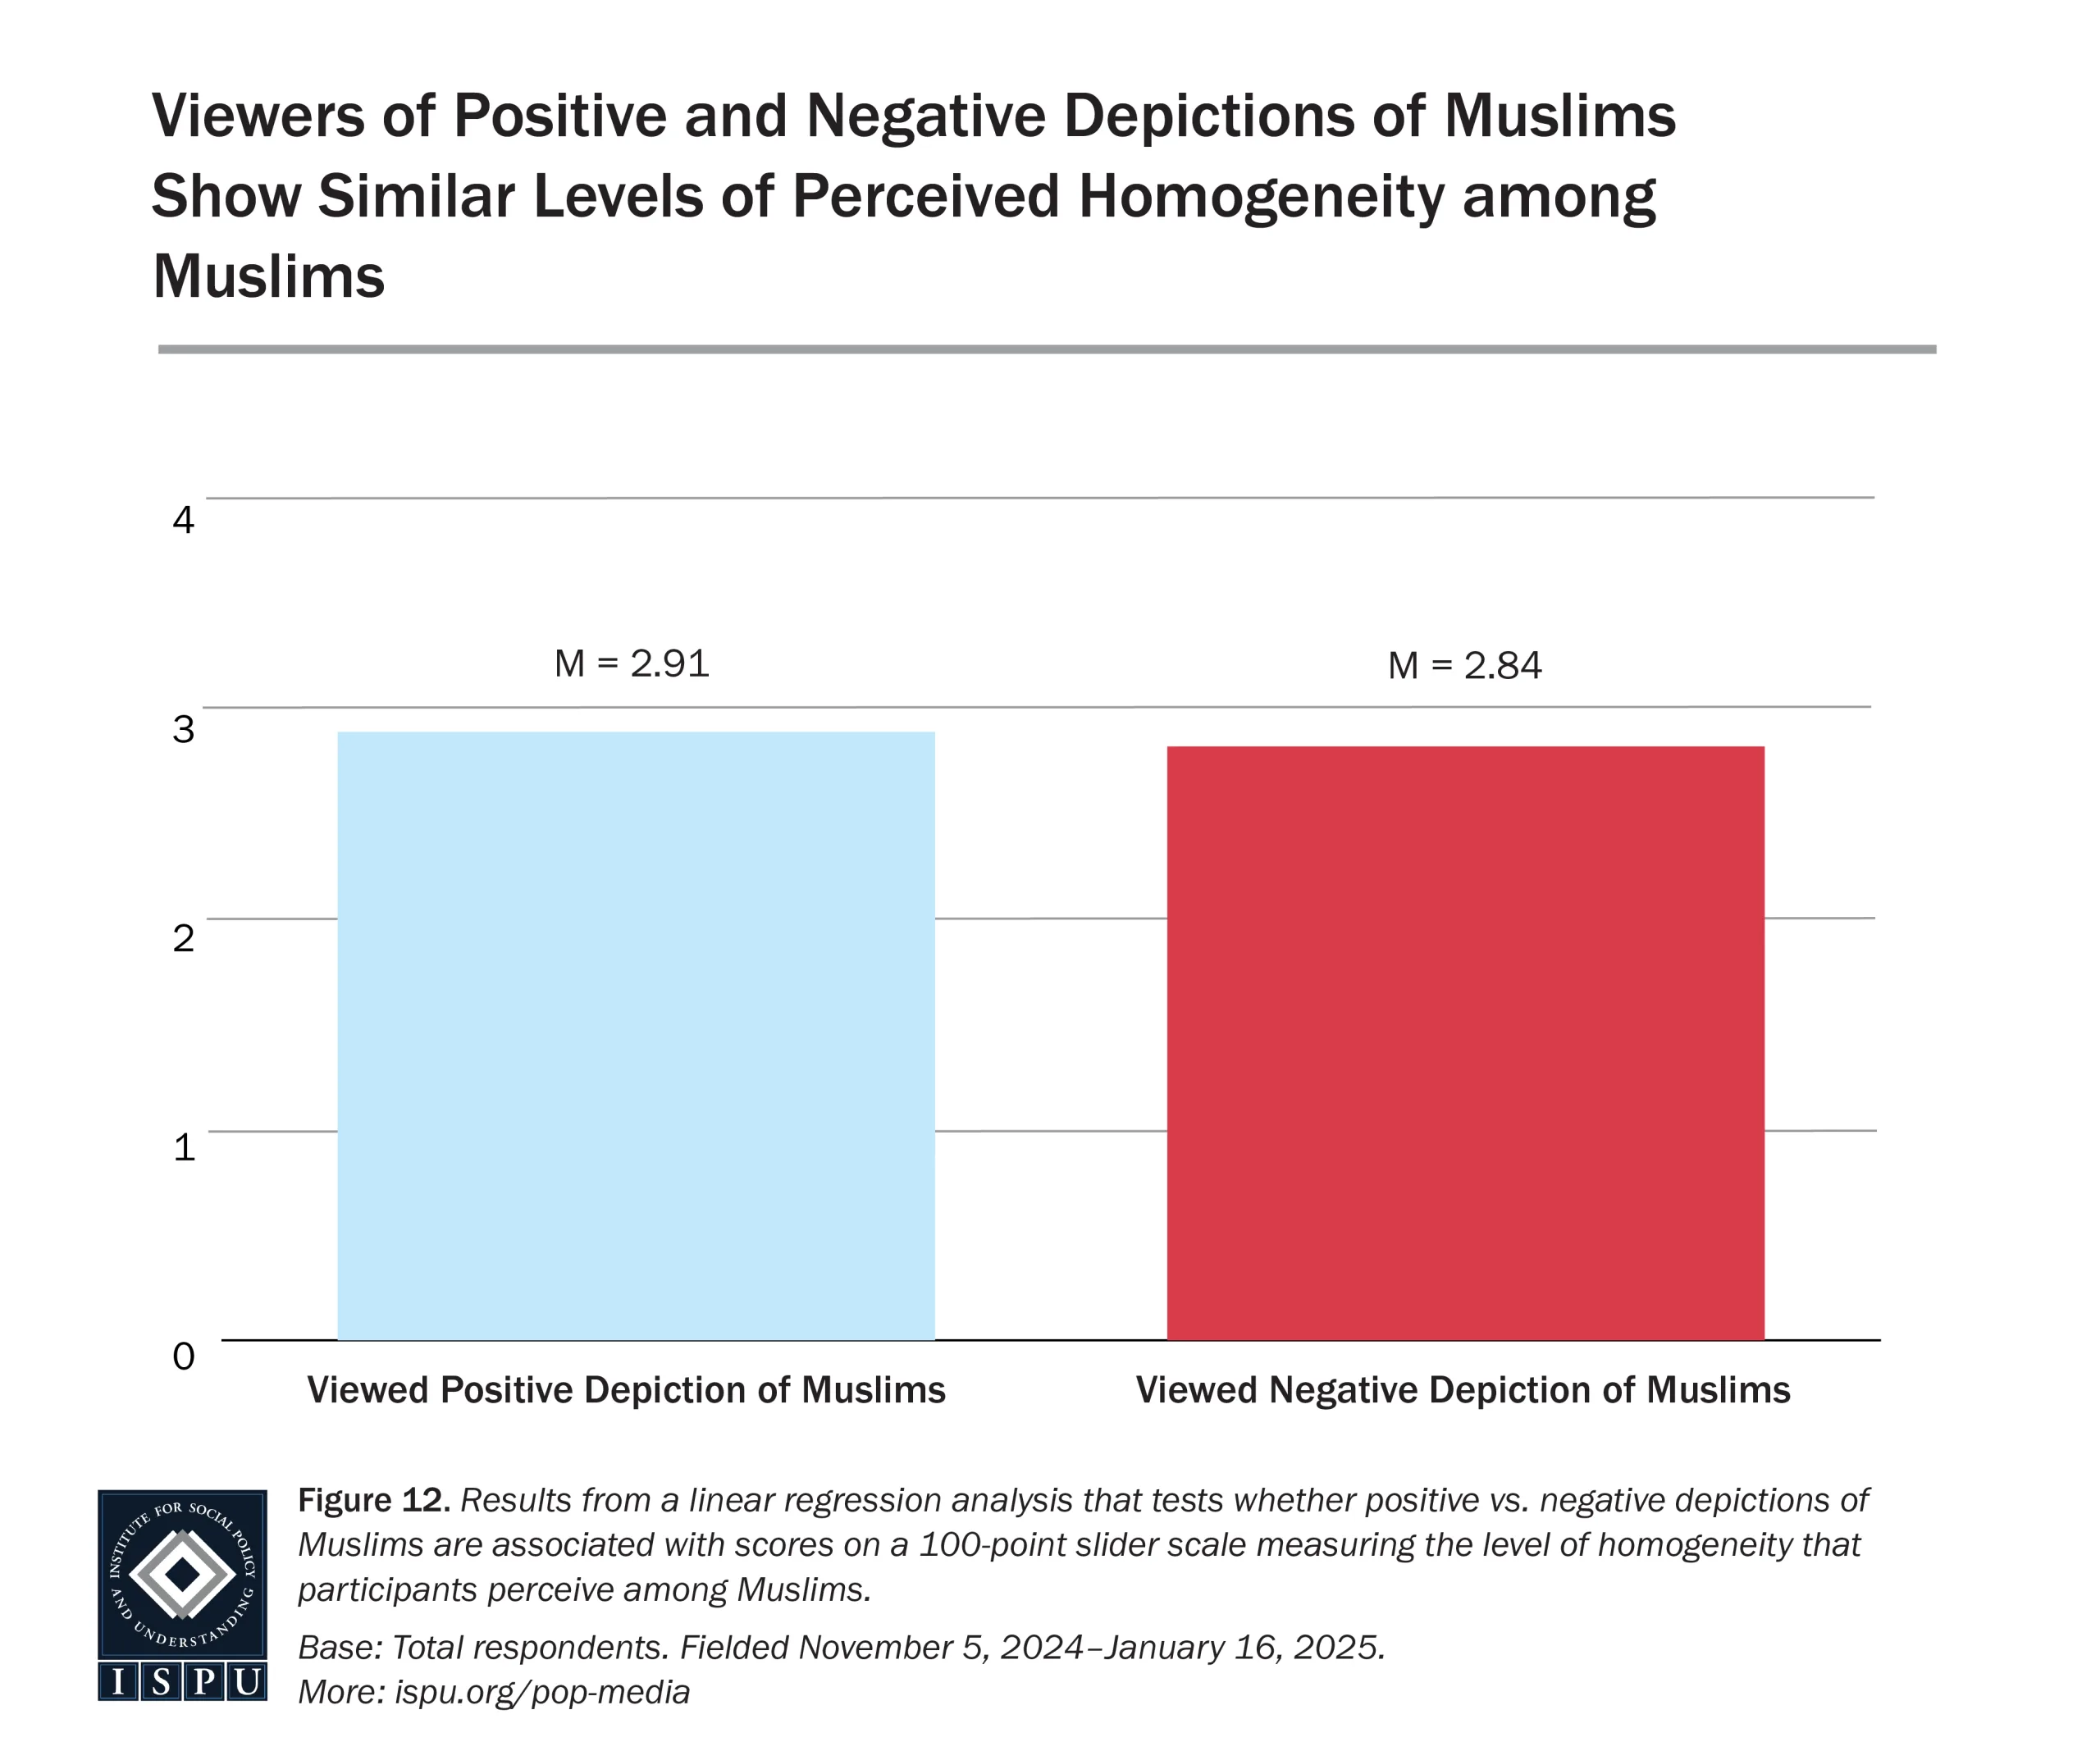
The primary contrast comparing the positive Muslim representation to the negative Muslim representation showed that there were no significant differences in perceived homogeneity of Muslims among those who watched the positive (M = 2.91, SD = 1.19) representation and those who watched the negative (M = 2.84, SD = 1.15) representation.n Thus, the nature of how Muslims are represented on TV did not influence perceptions of the diversity within the Muslim community, likely because depictions in the shows in this study were heavily focused on singular Muslim characters and the Muslims immediately surrounding those characters (i.e., family, close friends) and not the larger Muslim community.